
Massive merger of galaxies is the most powerful on record
With ESA’s XMM-Newton observatory, an international team of scientists has observed a nearby head-on collision of two galaxy clusters that has smashed together thousands of galaxies and millions upon millions of stars. It is one of the most powerful events ever witnessed. Such collisions are second only to the Big Bang in total energy output.
The event details what the scientists are calling the ‘perfect cosmic storm’: galaxy clusters that collided like two high-pressure weather fronts and created hurricane-like conditions, tossing galaxies far from their paths and churning shock waves of 100-million-degree gas through intergalactic space.
This unprecedented view of a merger in action crystallises the theory that the Universe built its magnificent hierarchal structure from the ‘bottom up’ - essentially through mergers of smaller galaxies and galaxy clusters into bigger ones.
"Here before our eyes we see the making of one of the biggest objects in the Universe," said Dr Patrick Henry of the University of Hawaii, who led the study. "What was once two distinct but smaller galaxy clusters 300 million years ago is now one massive cluster in turmoil.”
Henry and his colleagues, Alexis Finoguenov and Ulrich Briel of the Max-Planck Institute for Extraterrestrial Physics in Germany, present these results in an upcoming issue of the Astrophysical Journal. The forecast for the new super-cluster, they said, is 'clear and calm' now that the worst of the storm has passed.
Galaxy clusters are the largest gravitationally bound structures in Universe, containing hundreds to thousands of galaxies. Our Milky Way galaxy is part of a small group of galaxies but is not gravitationally bound to the closest cluster, the Virgo Cluster. We are destined for a collision in a few thousand million years, though.
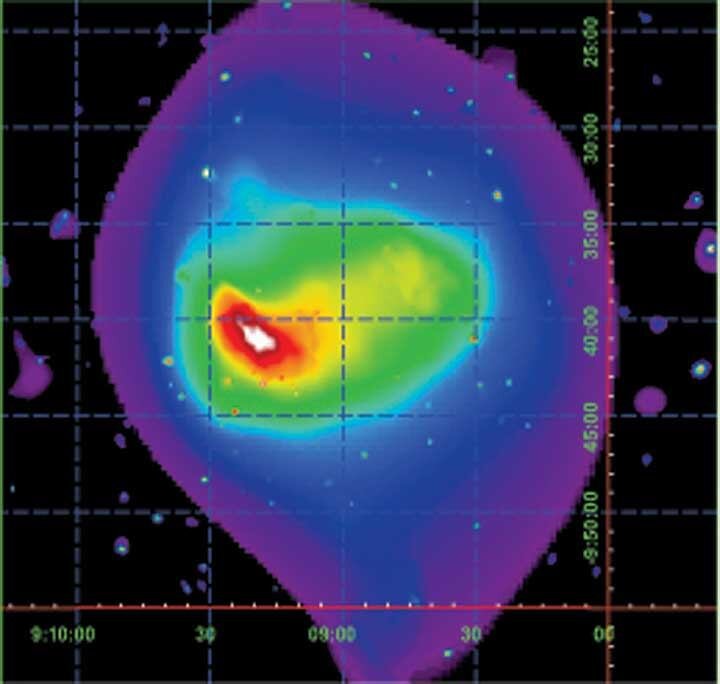
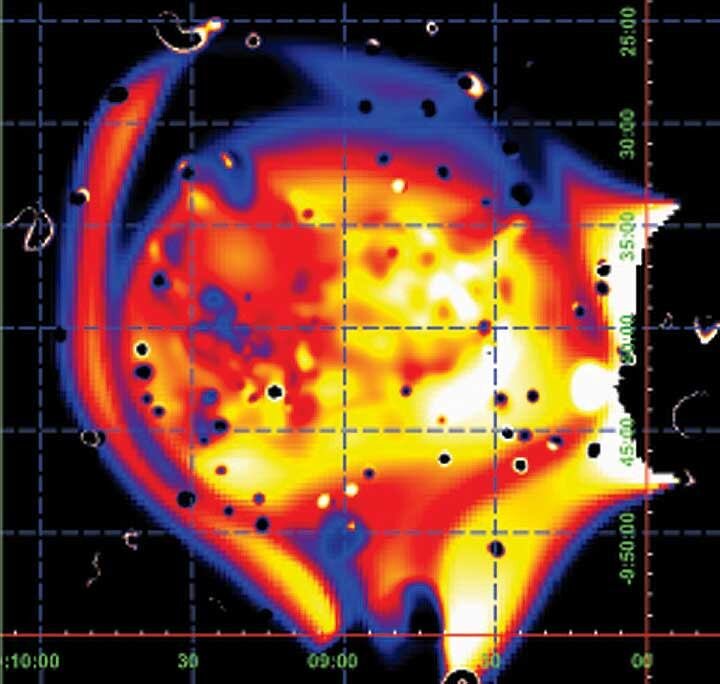
The cluster named Abell 754 in the constellation Hydra has been known for decades. However, to the scientists' surprise, the new observation reveals that the merger may have occurred from the opposite direction than what was thought. They found evidence for this by tracing the wreckage today left in the merger's wake, spanning a distance of millions of light years. While other large mergers are known, none has been measured in such detail as Abell 754.
For the first time, the scientists could create a complete ‘weather map’ of Abell 754 and thus determine a forecast. This map contains information about the temperature, pressure and density of the new cluster. As in all clusters, most the ordinary matter is in the form of gas between the galaxies and not locked up in the galaxies or stars themselves. The massive forces of the merging clusters accelerated intergalactic gas to great speeds. This resulted in shock waves that heat the gas to very high temperatures, which then radiated X-ray light, far more energetic than the visible light our eyes can detect. XMM-Newton, in orbit, detects this type of high-energy light.
The dynamics of the merger revealed by XMM-Newton point to a cluster in transition. "One cluster has apparently smashed into the other from the 'north-west' and has since made one pass through," said Finoguenov. "Now, gravity will pull the remnants of this first cluster back towards the core of the second. Over the next few thousand million of years, the remnants of the clusters will settle and the merger will be complete."
The observation implies that the largest structures in the Universe are essentially still forming in the modern era. Abell 754 is relatively close, about 800 million light years away. The construction boom may soon be over in a few more thousand million years though. A mysterious substance dubbed 'dark energy' appears to be accelerating the Universe's expansion rate. This means that objects are flying apart from each other at an ever-increasing speed and that clusters may eventually never have the opportunity to collide with each other.
X-ray observations of galaxy clusters such as Abell 754 will help to better define dark energy and also dark matter, an ‘invisible’ and mysterious substance that appears to comprise over 80 percent of a galaxy cluster's mass.
This observation was announced at a NASA Internet press conference today. A paper describing these results, by Patrick Henry and his collaborators, will be published in the Astrophysical Journal.
Images and other visual material are available at the NASA galaxy merger website.
