ERS altimeter survey shows growth of Greenland Ice Sheet interior
Researchers have utilised more than a decade's worth of data from radar altimeters on ESA's ERS satellites to produce the most detailed picture yet of thickness changes in the Greenland Ice Sheet.
A Norwegian-led team used the ERS data to measure elevation changes in the Greenland Ice Sheet from 1992 to 2003, finding recent growth in the interior sections estimated at around six centimetres per year during the study period. The research is due to be published by Science Magazine in November, having been published in the online Science Express on 20 October.
ERS radar altimeters work by sending 1800 separate radar pulses down to Earth per second then recording how long their echoes take to bounce back 800 kilometres to the satellite platform. The sensor times its pulses' journey down to under a nanosecond to calculate the distance to the planet below to a maximum accuracy of two centimetres.
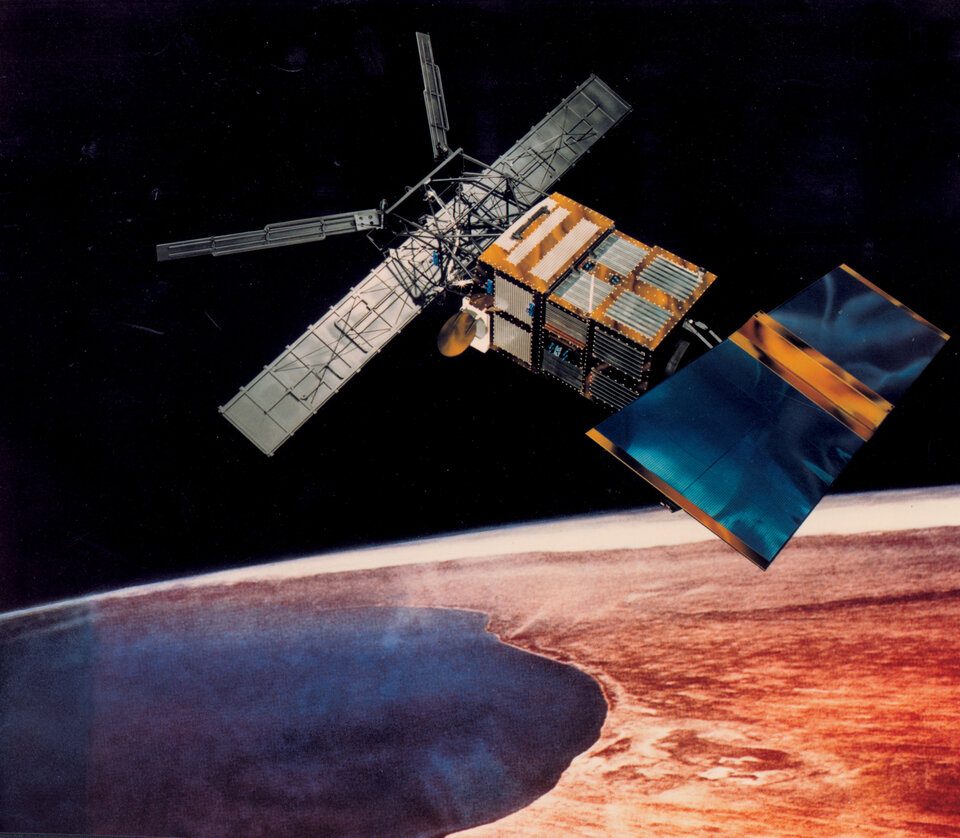
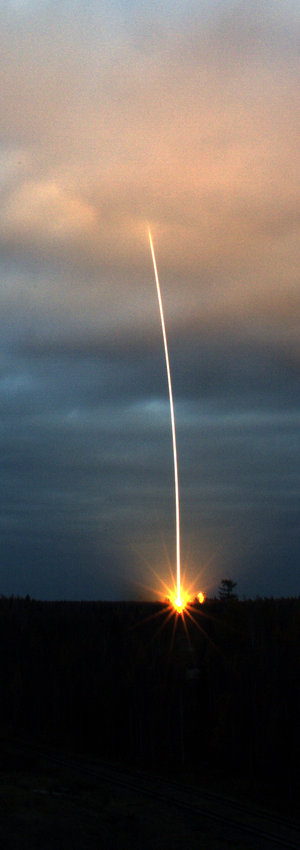
ESA has had at least one working radar altimeter in polar orbit since July 1991, when ERS-1 was launched. ESA's first Earth Observation spacecraft was joined by ERS-2 in April 1995, then the ten-instrument Envisat satellite in March 2002.
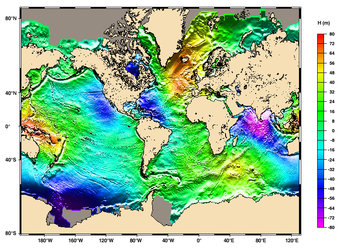
The result is a scientifically valuable long-term dataset covering Earth's oceans and land as well as ice fields – which can be used to reduce uncertainty about whether land ice sheets are growing or shrinking as concern grows about the effects of global warming.
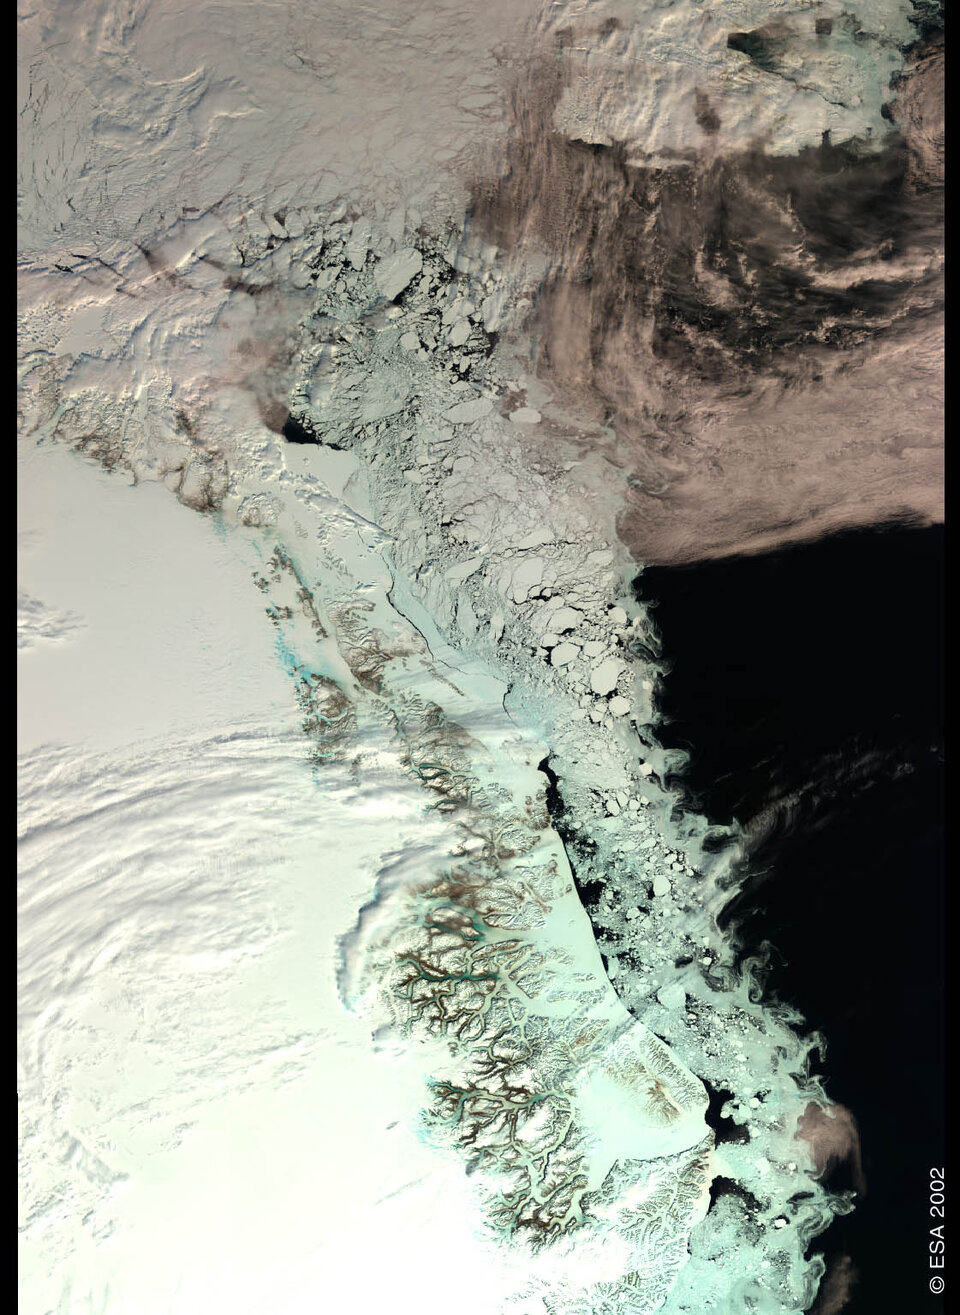
The ice sheet covering Earth's largest island of Greenland has an area of 1 833 900 square kilometres and an average thickness of 2.3 kilometres. It is the second largest concentration of frozen freshwater on Earth and if it were to melt completely global sea level would increase by up to seven metres.
The influx of freshwater into the North Atlantic from any increase in melting from the Greenland Ice Sheet could also weaken the Gulf Stream, potentially seriously impacting the climate of northern Europe and the wider world.
Efforts to measure changes in the Greenland Ice Sheet using field observations, aircraft and satellites have improved scientific knowledge during the last decade, but there is still no consensus assessment of the ice sheet's overall mass balance. There is however evidence of melting and thinning in the coastal marginal areas in recent years, as well as indications that large Greenland outlet glaciers can surge, possibly in response to climate variations.

Much less known are changes occurring in the vast elevated interior area of the ice sheet. Therefore an international team of scientists - from Norway's Nansen Environmental and Remote Sensing Center (NERSC), Mohn-Sverdrup Center for Global Ocean Studies and Operational Oceanography and the Bjerknes Centre for Climate Research, Russia's Nansen International Environmental and Remote Sensing Center and the United States' Environmental Systems Analysis Research Center – were compelled to derive and analyse the longest continuous dataset of satellite altimeter observations of Greenland Ice Sheet elevations.
By combining tens of millions of data points from ERS-1 and ERS-2, the team determined spatial patterns of surface elevation variations and changes over an 11-year period.
The result is a mixed picture, with a net increase of 6.4 centimetres per year in the interior area above 1500 metres elevation. Below that altitude, the elevation-change rate is minus 2.0 cm per year, broadly matching reported thinning in the ice-sheet margins. The trend below 1500 metres however does not include the steeply-sloping marginal areas where current altimeter data are unusable.
The spatially averaged increase is 5.4 cm per year over the study area, when corrected for post-Ice Age uplift of the bedrock beneath the ice sheet. These results are remarkable because they are in contrast to previous scientific findings of balance in Greenland's high-elevation ice.
The team, led by Professor Ola M. Johannessen of NERSC, ascribe this interior growth of the Greenland Ice Sheet to increased snowfall linked to variability in regional atmospheric circulation known as the North Atlantic Oscillation (NAO). First discovered in the 1920s, the NAO acts in a similar way to the El Niño phenomenon in the Pacific, contributing to climate fluctuations across the North Atlantic and Europe.
Comparing their data to an index of the NAO, the researchers established a direct relationship between Greenland Ice Sheet elevation change and strong positive and negative phases of the NAO during winter, which largely control temperature and precipitation patterns over Greenland.
Professor Johannessen commented: "This strong negative correlation between winter elevation changes and the NAO index, suggests an underappreciated role of the winter season and the NAO for elevation changes – a wildcard in Greenland Ice Sheet mass balance scenarios under global warming."
He cautioned that the recent growth found by the radar altimetry survey does not necessarily reflect a long-term or future trend. With natural variability in the high-latitude climate cycle that includes the NAO being very large, even an 11-year long dataset remains short.
"There is clearly a need for continued monitoring using new satellite altimeters and other observations, together with numerical models to calculate the Greenland Ice Sheet mass budget," Johannessen added.
Modelling studies of the Greenland Ice Sheet mass balance under greenhouse global warming have shown that temperature increases up to about 3ºC lead to positive mass balance changes at high elevations – due to snow accumulation – and negative at low elevations – due to snow melt exceeding accumulation.
Such models agree with the new observational results. However after that threshold is reached, potentially within the next hundred years, losses from melting would exceed accumulation from increases in snowfall – then the meltdown of the Greenland Ice Sheet would be on.
A paper published in Science in June this year detailed the results of a similar analysis of the Antarctic Ice Sheet based on ERS radar altimeter data, carried out by a team led by Professor Curt Davis of the University of Missouri-Columbia.
The results showed thickening in East Antarctica on the order of 1.8 cm per year, but thinning across a substantial part of West Antarctica. Data were unavailable for much of the Antarctic Peninsula, subject to recent ice sheet thinning due to regional climate warming, again because of limitations in current radar altimeter performance.

ESA's CryoSat mission, lost during launch on 8 October, carried the world's first radar altimeter purpose-built for use over both land and sea ice. In the context of land ice sheets, CryoSat would have been capable of acquiring data over steeply-sloping ice margins which remain invisible to current radar altimeters - these being the very regions where the greatest loss is taking place.
Efforts are currently underway to investigate the possibility of building and flying a CryoSat-2, with a decision to be taken by the end of the year. In the meantime, the valuable climatological record of ice sheet change established by ERS and Envisat will continue to be extended.