Satellites shed light on global warming
As climate change continues to make headlines across the world, participants at the 2007 Envisat Symposium this week are hearing how Earth observation satellites allow scientists to better understand the parameters involved in global warming and how this is impacting the planet.
The cryosphere is both influenced by and has a major influence on climate. Because any increase in the melt rate of ice sheets and glaciers has the potential to greatly increase sea level, researchers are looking to the cryosphere to get a better idea of the likely scale of the impact of climate change. In addition, the melting of sea-ice will increase the amount of solar radiation that will be absorbed by ice-free polar oceans rather than reflected by ice-covered oceans, increasing the ocean temperature.
Average temperatures in the Antarctic Peninsula have risen over the last 50 years by half a degree Celsius a decade and are having an impact on the ice shelves and glaciers. Innsbruck University's Professor Helmut Rott has been observing the accelerated retreat and break-up of the Larsen Ice Shelf on the Antarctic Peninsula in the face of this warming through radar images acquired by ESA’s ERS and Envisat satellites.
The retreat has been accelerating since 1992 and has culminated in two collapse events: Larsen-A in January 1995 and Larsen-B in March 2002. Envisat captured the disintegration of the 200-metre-thick Larsen-B Ice Shelf, which researchers estimate had been stable since the last ice age 12 000 years ago.
"This retreat was triggered by climate warming, which caused prolonged summer melt seasons and the formation of extended melt water streams and ponds on the ice shelf surfaces," Rott said.
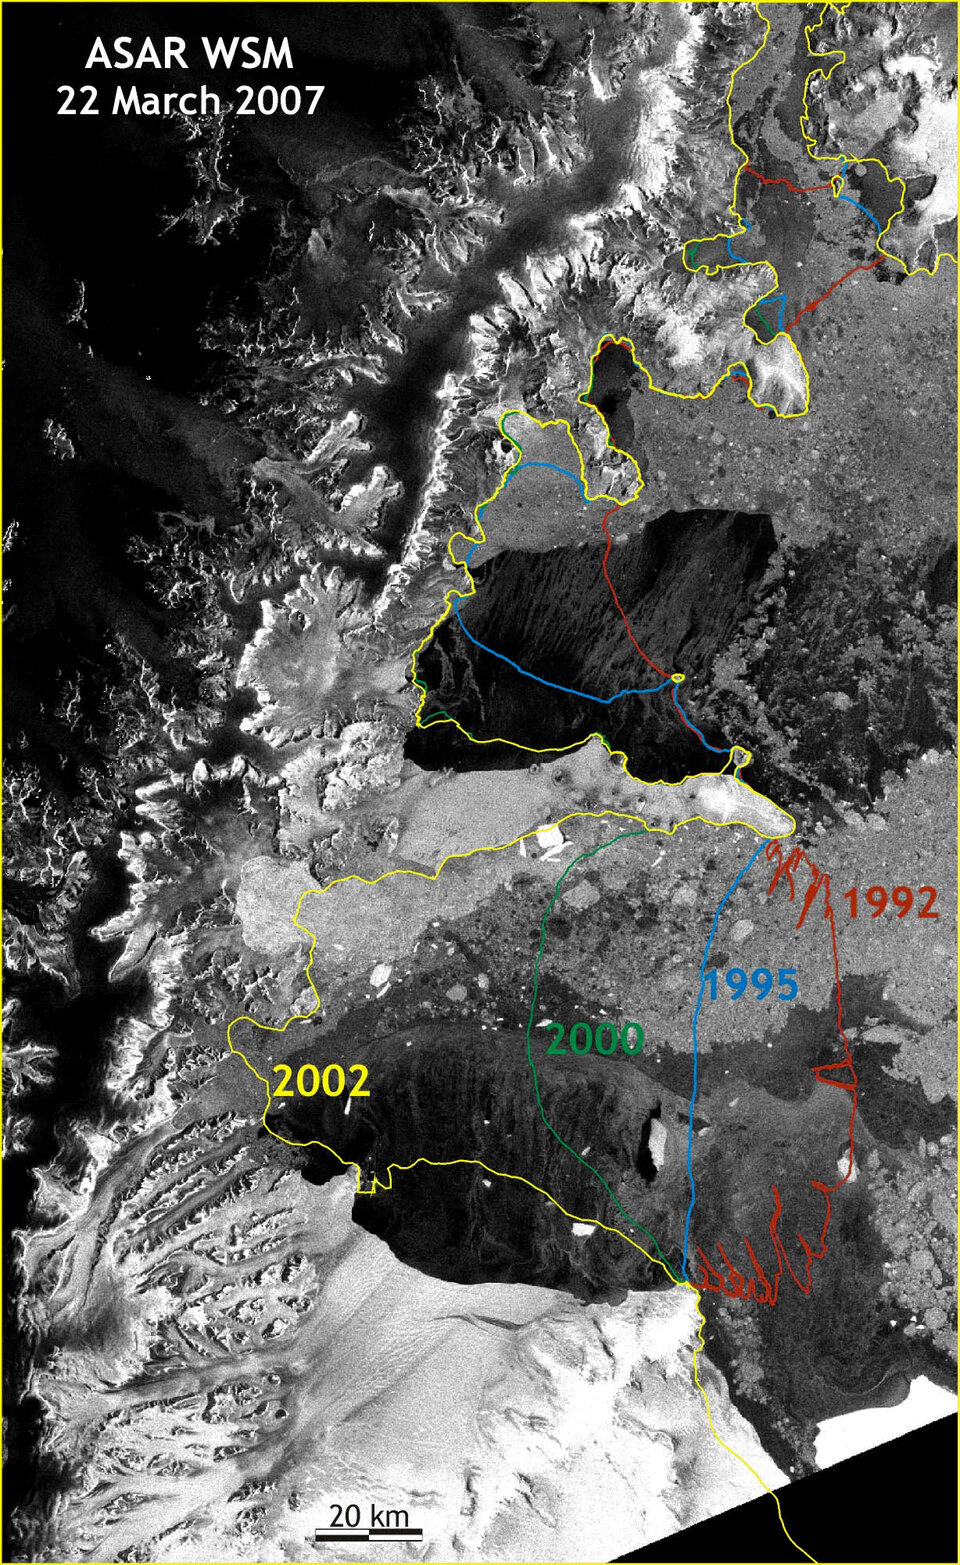
The sections of Larsen-A, which disintegrated almost completely in January 1995, and Larsen-B that broke away were 200 to 350 metres thick. According to Rott, only 1403 square kilometres of Larsen-B remain and will soon break away completely.
After the collapse event in 2002, the outlet glaciers from the Antarctic Peninsula that previously nourished the ice shelf retreated many kilometres above the previous grounding line. Altogether about 250 square kilometres of grounded ice have been lost at the outlet glaciers of former Larsen-A and Larsen-B ice shelves.
The remoteness, darkness and cloudiness of Earth’s Polar Regions make them difficult to study. An instrument known as the Advanced Synthetic Aperture Radar (ASAR) allows Envisat to produce high-quality images of ice sheets because it is able to pierce through clouds and darkness.
In addition to mapping ice boundaries, Rott used repeat-pass ASAR image data to map the flow velocities of glaciers. All the glaciers, where the buttressing ice had disappeared, have accelerated significantly. The retreat of grounded ice and the accelerated ice export due to increased velocity result in strongly negative mass balance of the glaciers.
"The velocity of the glaciers increased up to eight-fold compared to the speed when the ice shelf buttressed the glaciers," Rott said. "The total estimated mass loss of glaciers above the disintegrated ice shelf sections since 2002 has been equivalent to about 2 percent of total sea level rise, which, although not a significant percentage, demonstrates the vulnerability of ice shelves to climatic warming and the importance of ice shelves for the stability of glaciers up-stream."
"The disintegration processes observed at Larsen Ice Shelf are very relevant for estimating the future response to climatic warming of the much larger ice masses of West Antarctica, which contain freshwater equivalent to several metres of sea-level rise," Rott added.
Faster waves in a warmer ocean may result in complex repercussions on the climate system
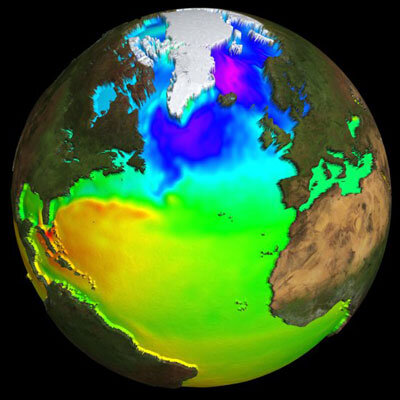
Satellites have been extremely beneficial to scientists in understanding oceanic planetary waves, which are internal waves that have major effects on large-scale ocean circulation and thus on climate. These very long waves travel slowly across the oceanic basins influencing the major oceanic currents and are believed to play a role in the complex ‘planetary clock’ that triggers one of the major climatic anomalies – El Niño.
"These waves are an important means of ocean adjustment to forcing. In a sense they ‘set the rhythm’ for some aspects of the interactions between oceans and climate. Faster waves in a warmer ocean, as an effect of climate change, may result in complex repercussions on the climate system, many of which could turn out to accelerate the change," Dr Paolo Cipollini of the National Oceanography Centre in the UK said.
Cipollini illustrated the role satellite instruments have played in understanding these elusive waves. He pointed out that although they were theorised to have existed as far back as the 1930s, it was not until the advent of the satellite-borne radar altimeter that oceanographers were able to offer proof of their existence by mapping the sea surface height and seeing them move by following the measurements of the surface.
Radar altimeters work by sending thousands of separate radar pulses down to Earth per second then recording how long their echoes take to bounce back to the satellite platform. The sensor times its pulses' journey down to under a nanosecond to calculate the distance to the planet below to a maximum accuracy of two centimetres. ESA has had radar altimeters in orbit since July 1991, when ERS-1 was launched, which was followed by ERS-2 in 1995 and Envisat in 2002 and will continue to launch radar altimeters with CryoSat planned for 2009 and Sentinel-3 planned for 2012.
According to Cipollini, these waves have been recently observed to alter the colour of the sea, therefore they are believed to have some effect on phytoplankton – the tiny chlorophyll-pigmented algal cells that populate the oceans in huge numbers and play a leading role in the global carbon cycle and the primary production of nutrients.
Current research is investigating these relationships by exploiting the powerful union of multiple views of the ocean made possible by different instruments like those in the Envisat suite, such as the Radar altimeter, Along Track Scanning Radiometer (ATSR) and Medium Resolution Imaging Spectrometer (MERIS). Envisat carries 10 instruments aboard and generates data on Earth’s land, oceans, ice and atmosphere.
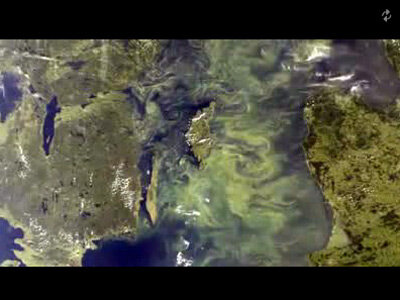
By comparing and contrasting information on ocean colour, surface temperature and sea level, scientists are exploring the many subtle ways in which these near-invisible waves are capable of affecting phytoplankton, as they may be providing them with an input of nutrient-rich water from the deep ocean as well as moving them around. These findings are then compared with the effect of waves in models, helping to make the models more realistic, which means better predictions for the future.
Cipollini cited a recent modelling study by Canadian researchers that shows planetary wave speed is expected to increase considerably during this century as a side effect of climate change induced warming of the oceans, which may have a number of far-reaching effects on ocean dynamics.
"It is no surprise, then, that scientists are eager to better understand these phenomena - and satellites provide both the indispensable validation of the theoretical hypotheses and the stimulus for new ideas," Cipollini said.
Sea surface temperature (SST) is one of the most stable of several geographical variables which, when determined globally, helps diagnose the state of the Earth’s climate system. Professor David Llewellyn-Jones, Head of Earth Observation Science at the University of Leicester, UK, outlined the importance of SST data at the symposium.
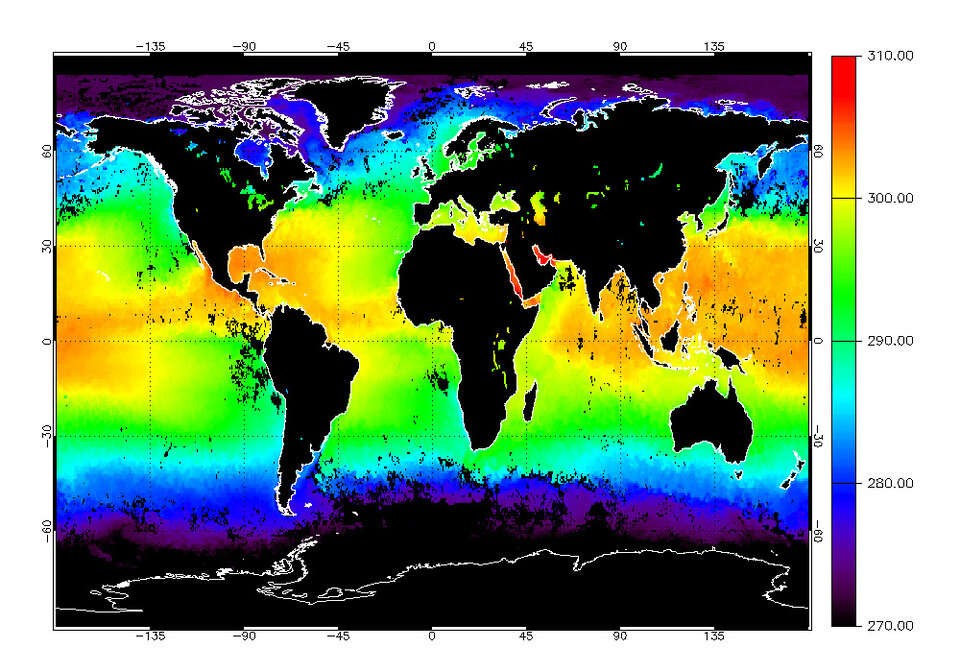
Tracking SST over a long period is arguably the most reliable way researchers know of measuring the precise rate at which global temperatures are increasing and improves the accuracy of our climate change models and weather forecasts.
"There is now evidence there is a distinctive upward trend in global sea surface temperatures, and this we can now see from measurements made from Envisat," Professor Llewellyn-Jones said.
Working like thermometers in the sky, a number of different satellite instruments measure SST on an ongoing basis, such as the AATSR aboard ESA's Envisat.
The AATSR instrument aboard Envisat and its predecessors, ATSR-1 and ATSR-2 on the ERS-1 and -2 satellites, has been providing researchers with a precise quantitative indication of the changes and variability associated with the climate system over the past 16 years.
There is a distinctive upward trend in global sea surface temperatures, and this we can now see from measurements made from Envisat
"Thanks to a new archive of uniformly processed data from 1991 to the present day, which is due to be launched later this year, it will soon be possible to provide a definitive statement of the rate at which global temperatures have been changing and how the variability of our climate has been changing," Llewellyn-Jones said.
"The ATSR instrument produces data of unrivalled accuracy on account of its unique dual view of the Earth’s surface, whereby each part of the surface is viewed twice, through two different atmospheric paths," Llewellyn-Jones added. "This not only enables scientists to correct for the effects of dust and haze, which degrade measurements of surface temperature from space, but also enables scientists to derive new measurements of the actual dust and haze, which are needed by climate scientists."