ESA satellites flying in formation
Based on the outstanding success of the first tandem mission between ERS-2 and Envisat last year, ESA has paired the two satellites together again to help improve our understanding of the planet.
ERS-2, ESA’s veteran spacecraft, and Envisat, the largest environmental satellite ever built, both carry Synthetic Aperture Radar (SAR) instruments that provide high resolution images of the Earth's surface.
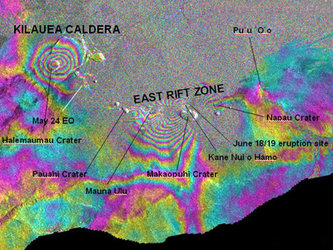
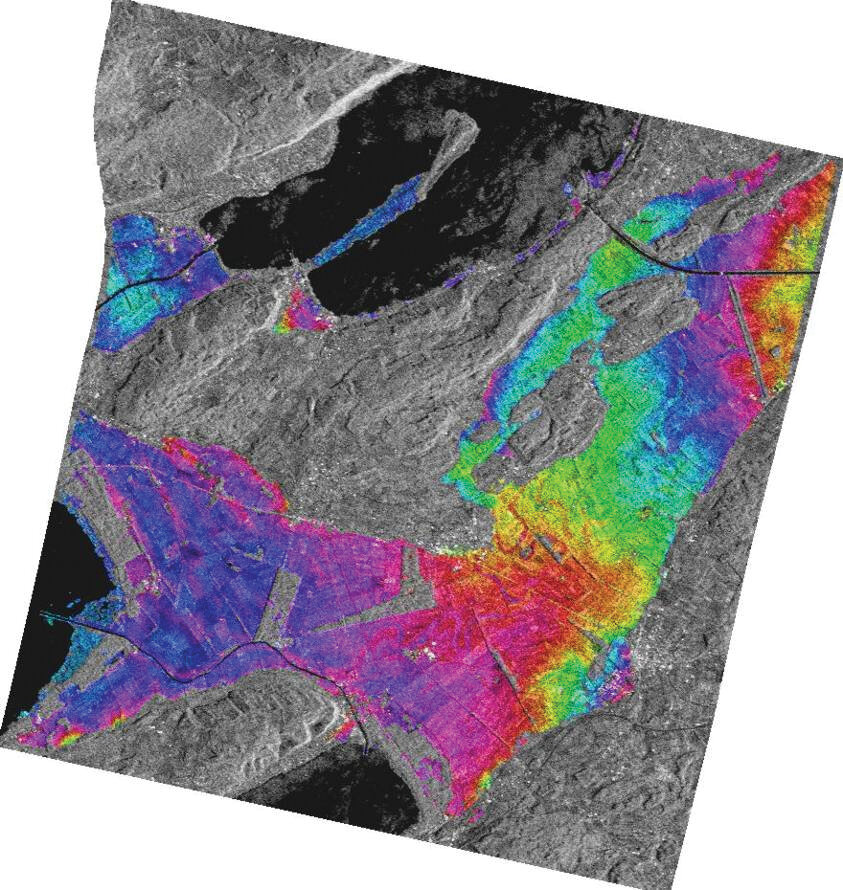
By combining two or more SAR images of the same site, slight alterations that may have occurred between acquisitions can be detected. This technique, known as SAR interferometry or InSAR, has proven to be very useful for applications such as glacier monitoring, surface deformation detection and terrain mapping.
ESA engineers configured the first SAR tandem mission, which took place from September 2007 to February 2008, and the current one, which began on 23 November, to ensure that the satellites both acquire data over the same area just 28 minutes apart.
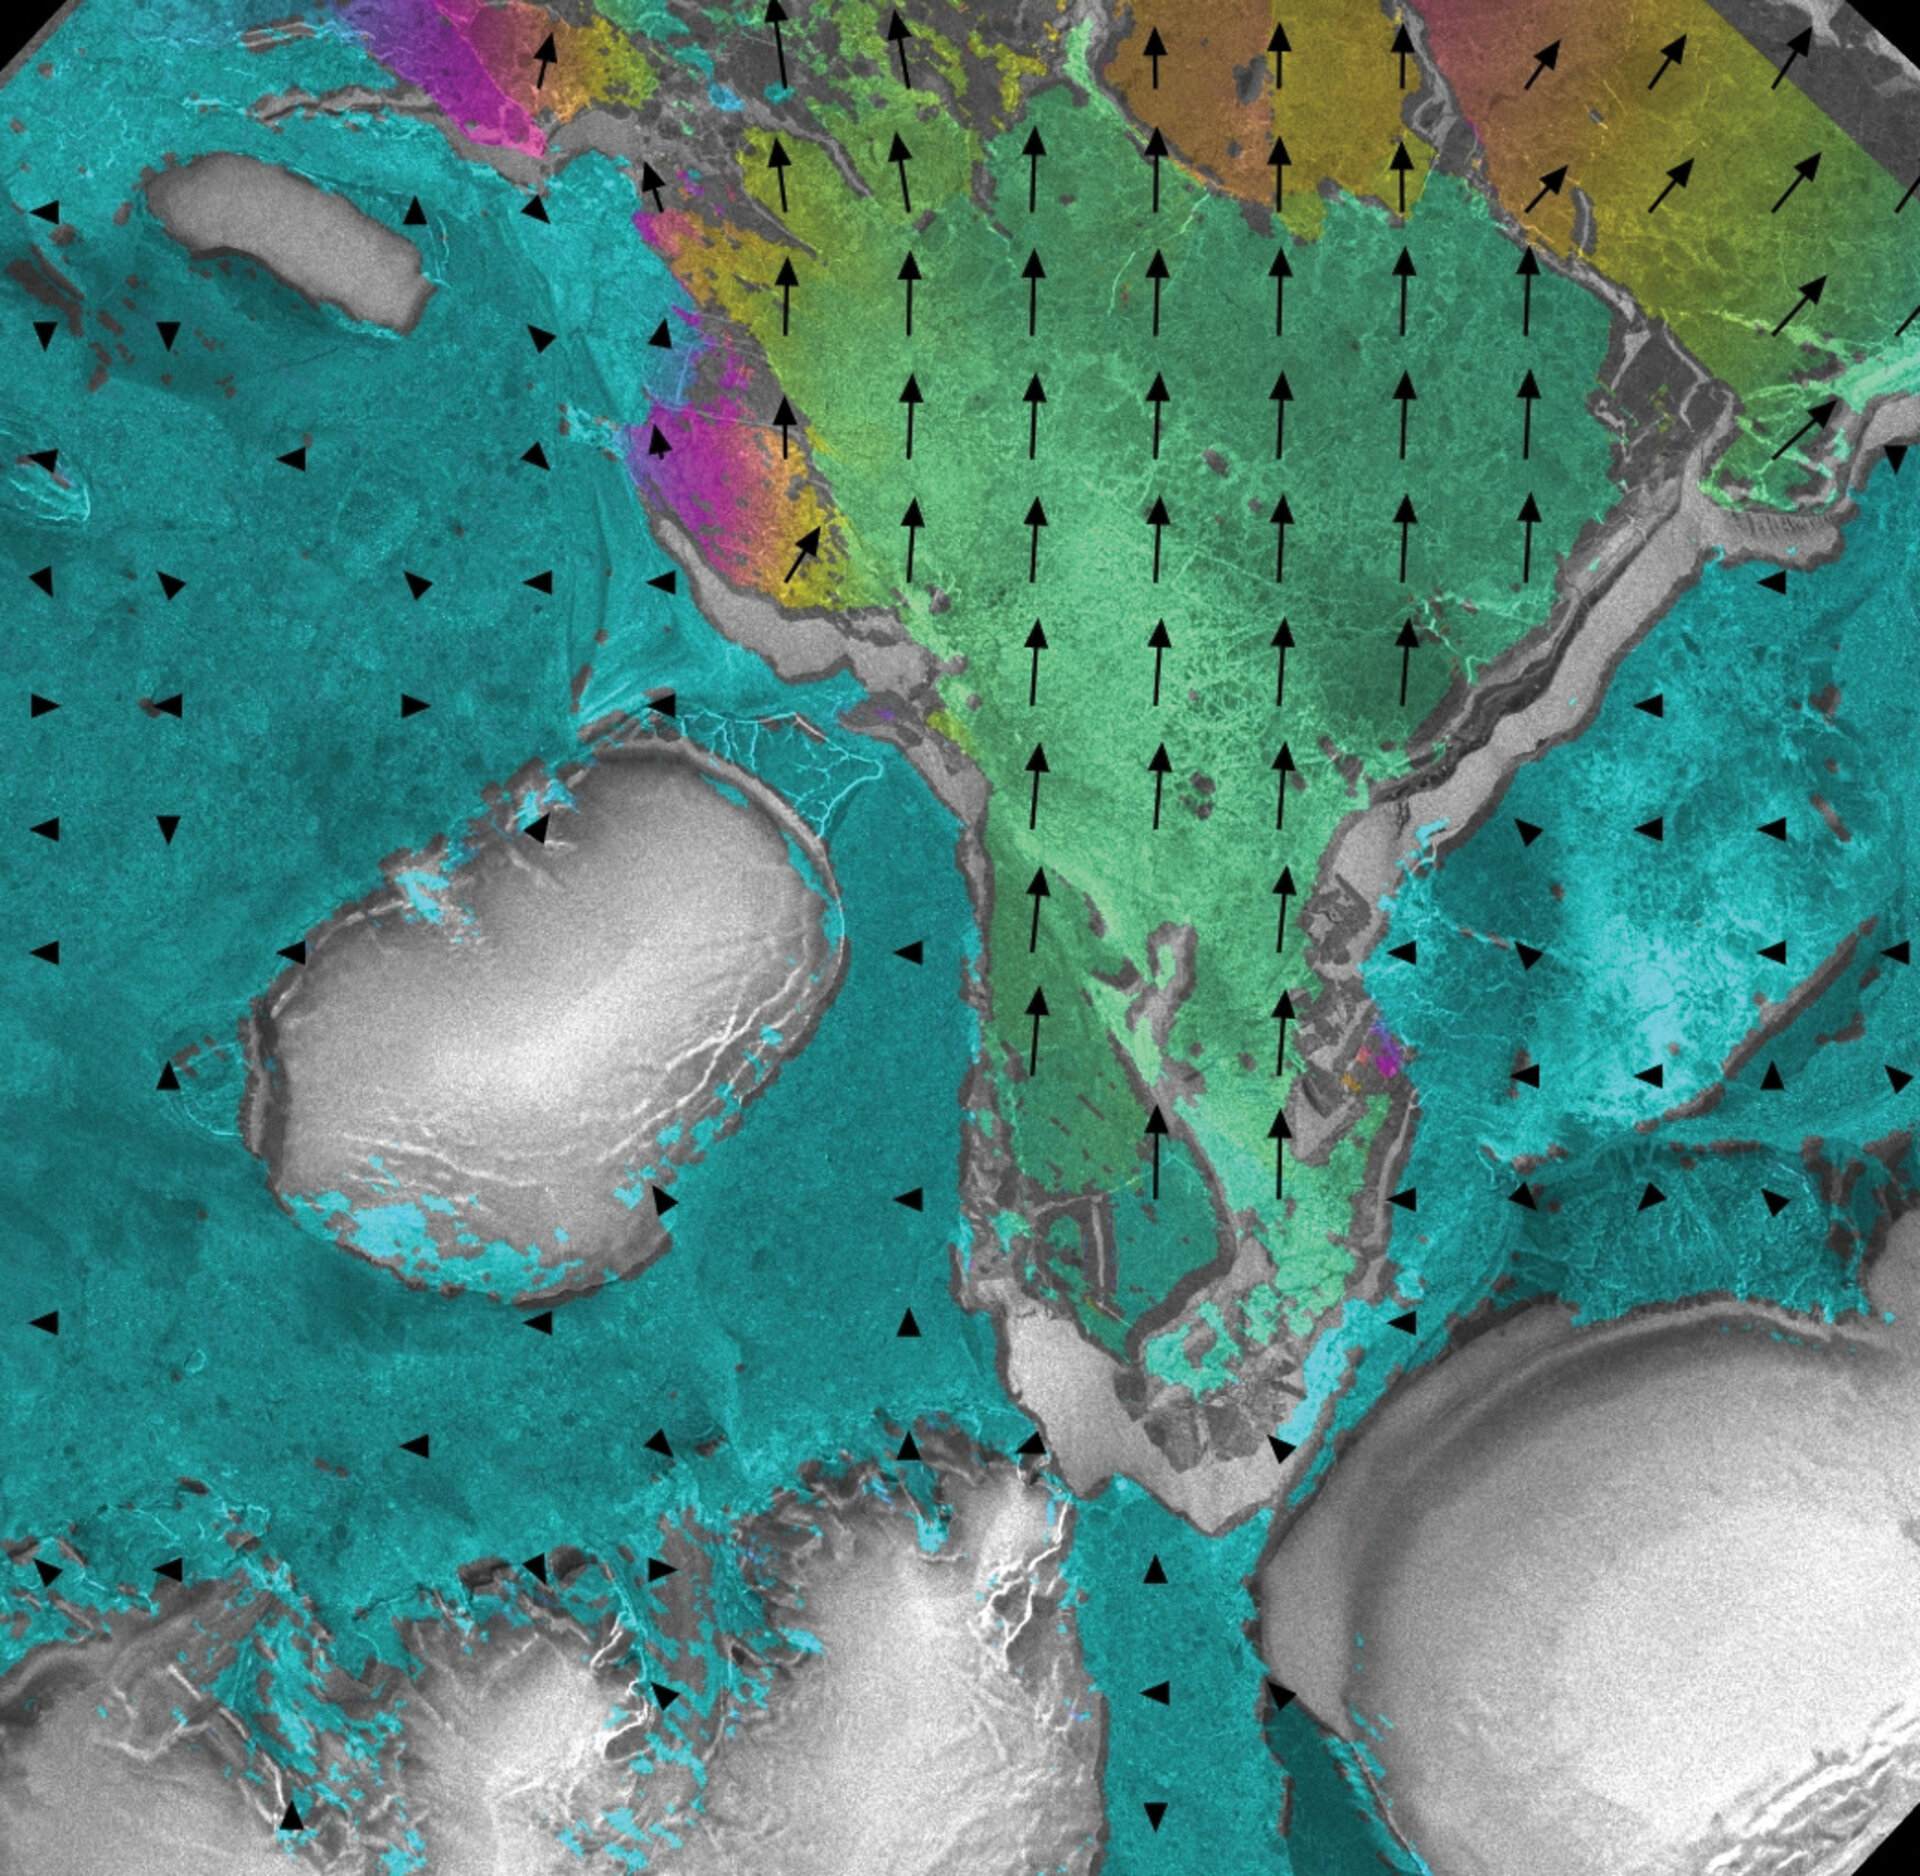
This short time separation allows for changes that occur quickly to be detected. Fast-moving glaciers, for instance, move more than 200 m per year and can move as much as 1 cm in 30 minutes. The ability to detect these small changes occurring on the ground between acquisitions is also allowing scientists to understand better and improve the quality of the SAR interferometry technique.
The current tandem mission, scheduled to run until 27 January 2009, is continuing the work of the first tandem mission with respect to measuring the velocity of fast-moving glaciers, detecting land-ice motion and developing elevation models over flat terrain.
However, based on the first mission’s proven ability to provide precise elevation information over flat regions, data from the current mission will also be used to identify natural carbon sources and sinks in Kazakh Steppe and wetlands in permafrost regions.
A challenging configuration
ESA engineers had to overcome many challenges in order to put Envisat and ERS-2 into a tandem flight configuration. For instance, in 2001 ERS-2 lost the ability to be manoeuvred in the usual way by onboard gyroscopes, navigational tools that allow mission controllers to maintain the correct position of satellites.

The operational lifetime of satellite missions is normally determined by the functioning of onboard gyroscopes. Without them, the ESA team had to work out a way of positioning the spacecraft by operating onboard sensors in a new way.
Part of their creative solution involved using a device called the Digital Earth Sensor (DES), which is designed to provide the horizon line to allow basic checks on the spacecraft’s position, and analysing Doppler frequency shifts in the signals of ERS-2’s radar instruments.
ERS-2, launched in 1995, and Envisat, launched in 2002, have exceeded the time they were intended to stay in orbit. Since they remain operational and continue to provide quality data about our planet, engineers are trying to use as little fuel as possible so as not to shorten their lifetimes.
"The strategy is to align the tandem start date with an Envisat manoeuvre. Therefore, there is no need to spend extra hydrazine for Envisat. For ERS, the manoeuvre to place it in tandem position is such that the satellite drifts back to its nominal orbit without additional manoeuvre after the tandem campaign," ESA Mission Planner Manager Sergio Vazzana said.