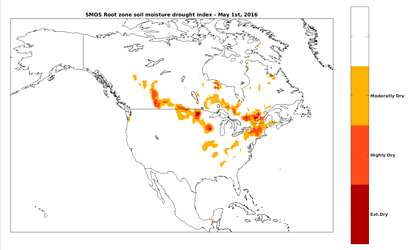
Applications
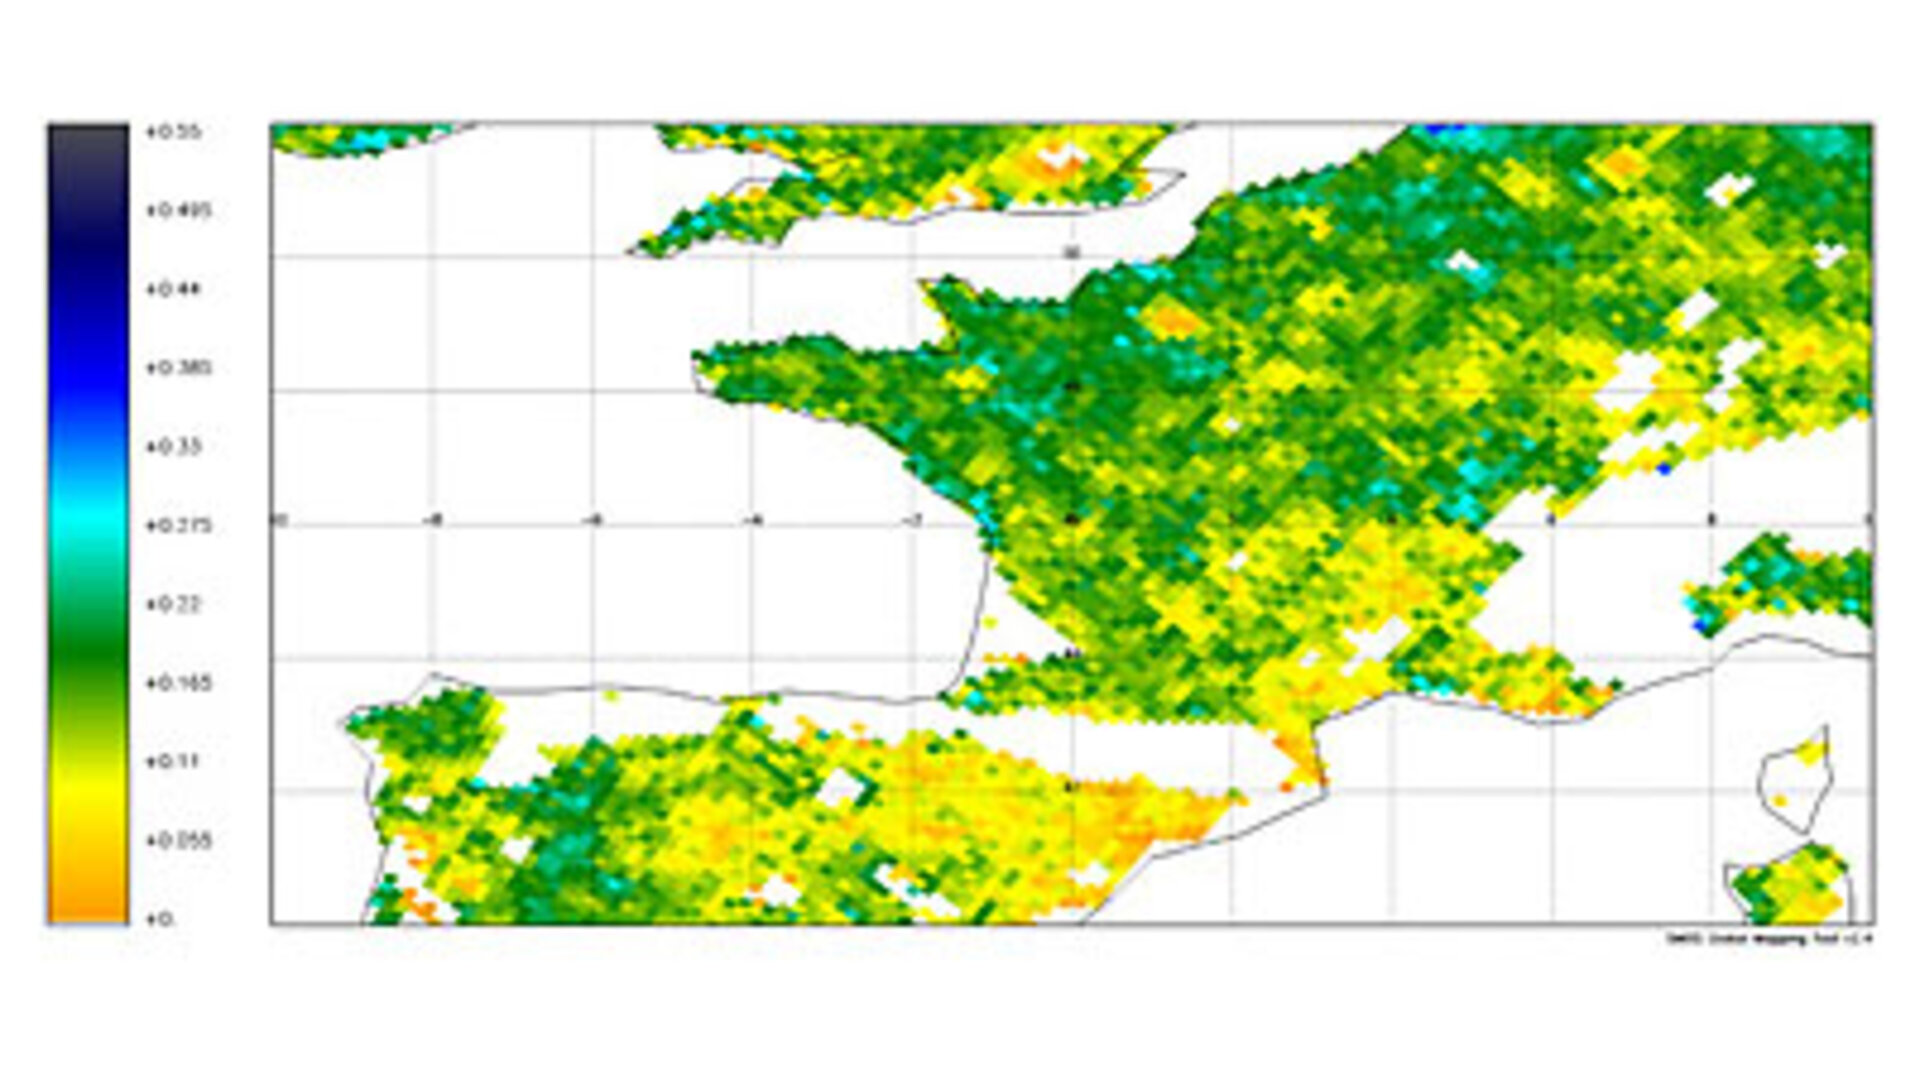
Comparison of soil moisture in 2010 and 2011
The animation, derived from data from SMOS, shows the difference in soil moisture in France between April 2010 and April 2011.The yellow colours indicate drier and the blue show wetter soils.