United space in Europe
Global map of land-cover dynamics
Applications

Global map of land-cover dynamics

21/03/2019 5286 views 40 likes 416982 ID
  • HI-RES JPG [3.50 MB]
  • HI-RES TIF

Thank you for liking

You have already liked this page, you can only like it once!

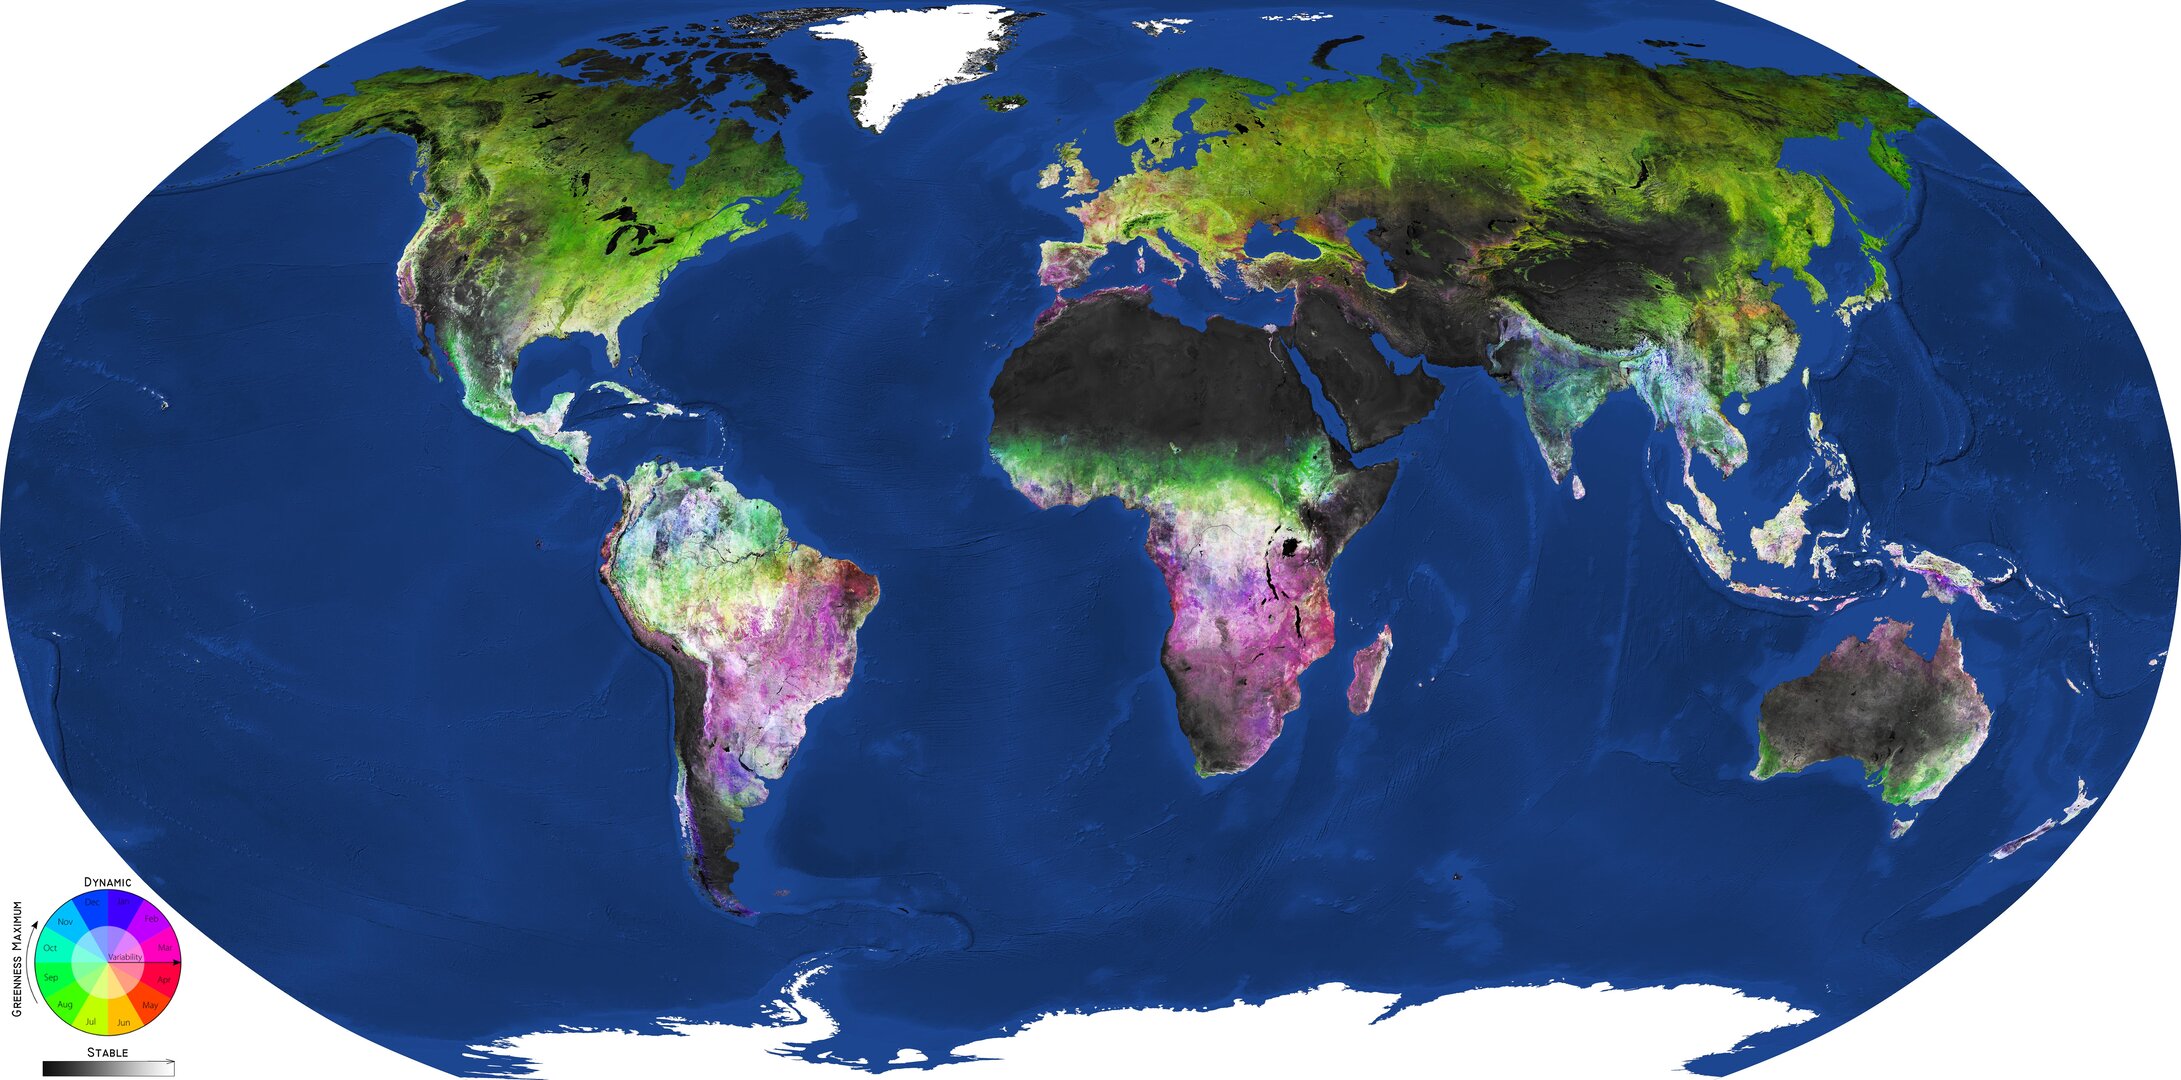
Data from the Copernicus Sentinel-2 mission has been used to generate a new high-resolution map of vegetation across Earth’s entire landmass. The new map depicts global vegetation dynamics and gives insight into land productivity.

The time of vegetation peak i.e. the month at which greenness maximum occurs is shown in red (spring) and green (summer) to blue tones (autumn and winter.) The variability of vegetation greenness is represented by light tones in low amplitude areas such as managed grasslands, while high amplitudes are represented by saturated colour tones. Areas with low biomass such as urban areas and open bodies of water are shown in black, while areas with higher biomass appear in grey and white tones.

  • contains modified Copernicus Sentinel data (2016–18), processed by GeoVille
  • Observing the Earth
  • Sentinel-2
  • Copernicus
Arctic land cover
Applications

Arctic land cover

Image 930 views 8 likes
Mapping Mexico’s land cover
Applications

Mapping Mexico’s land cover

Image 3542 views 28 likes
Central America land cover
Applications

Central America land cover

Image 1244 views 12 likes
Chiapas forest land-cover map
Applications

Chiapas forest land-cover map

Image 3734 views 47 likes
African land cover
Applications

African land cover

Image 8487 views 73 likes