Agency
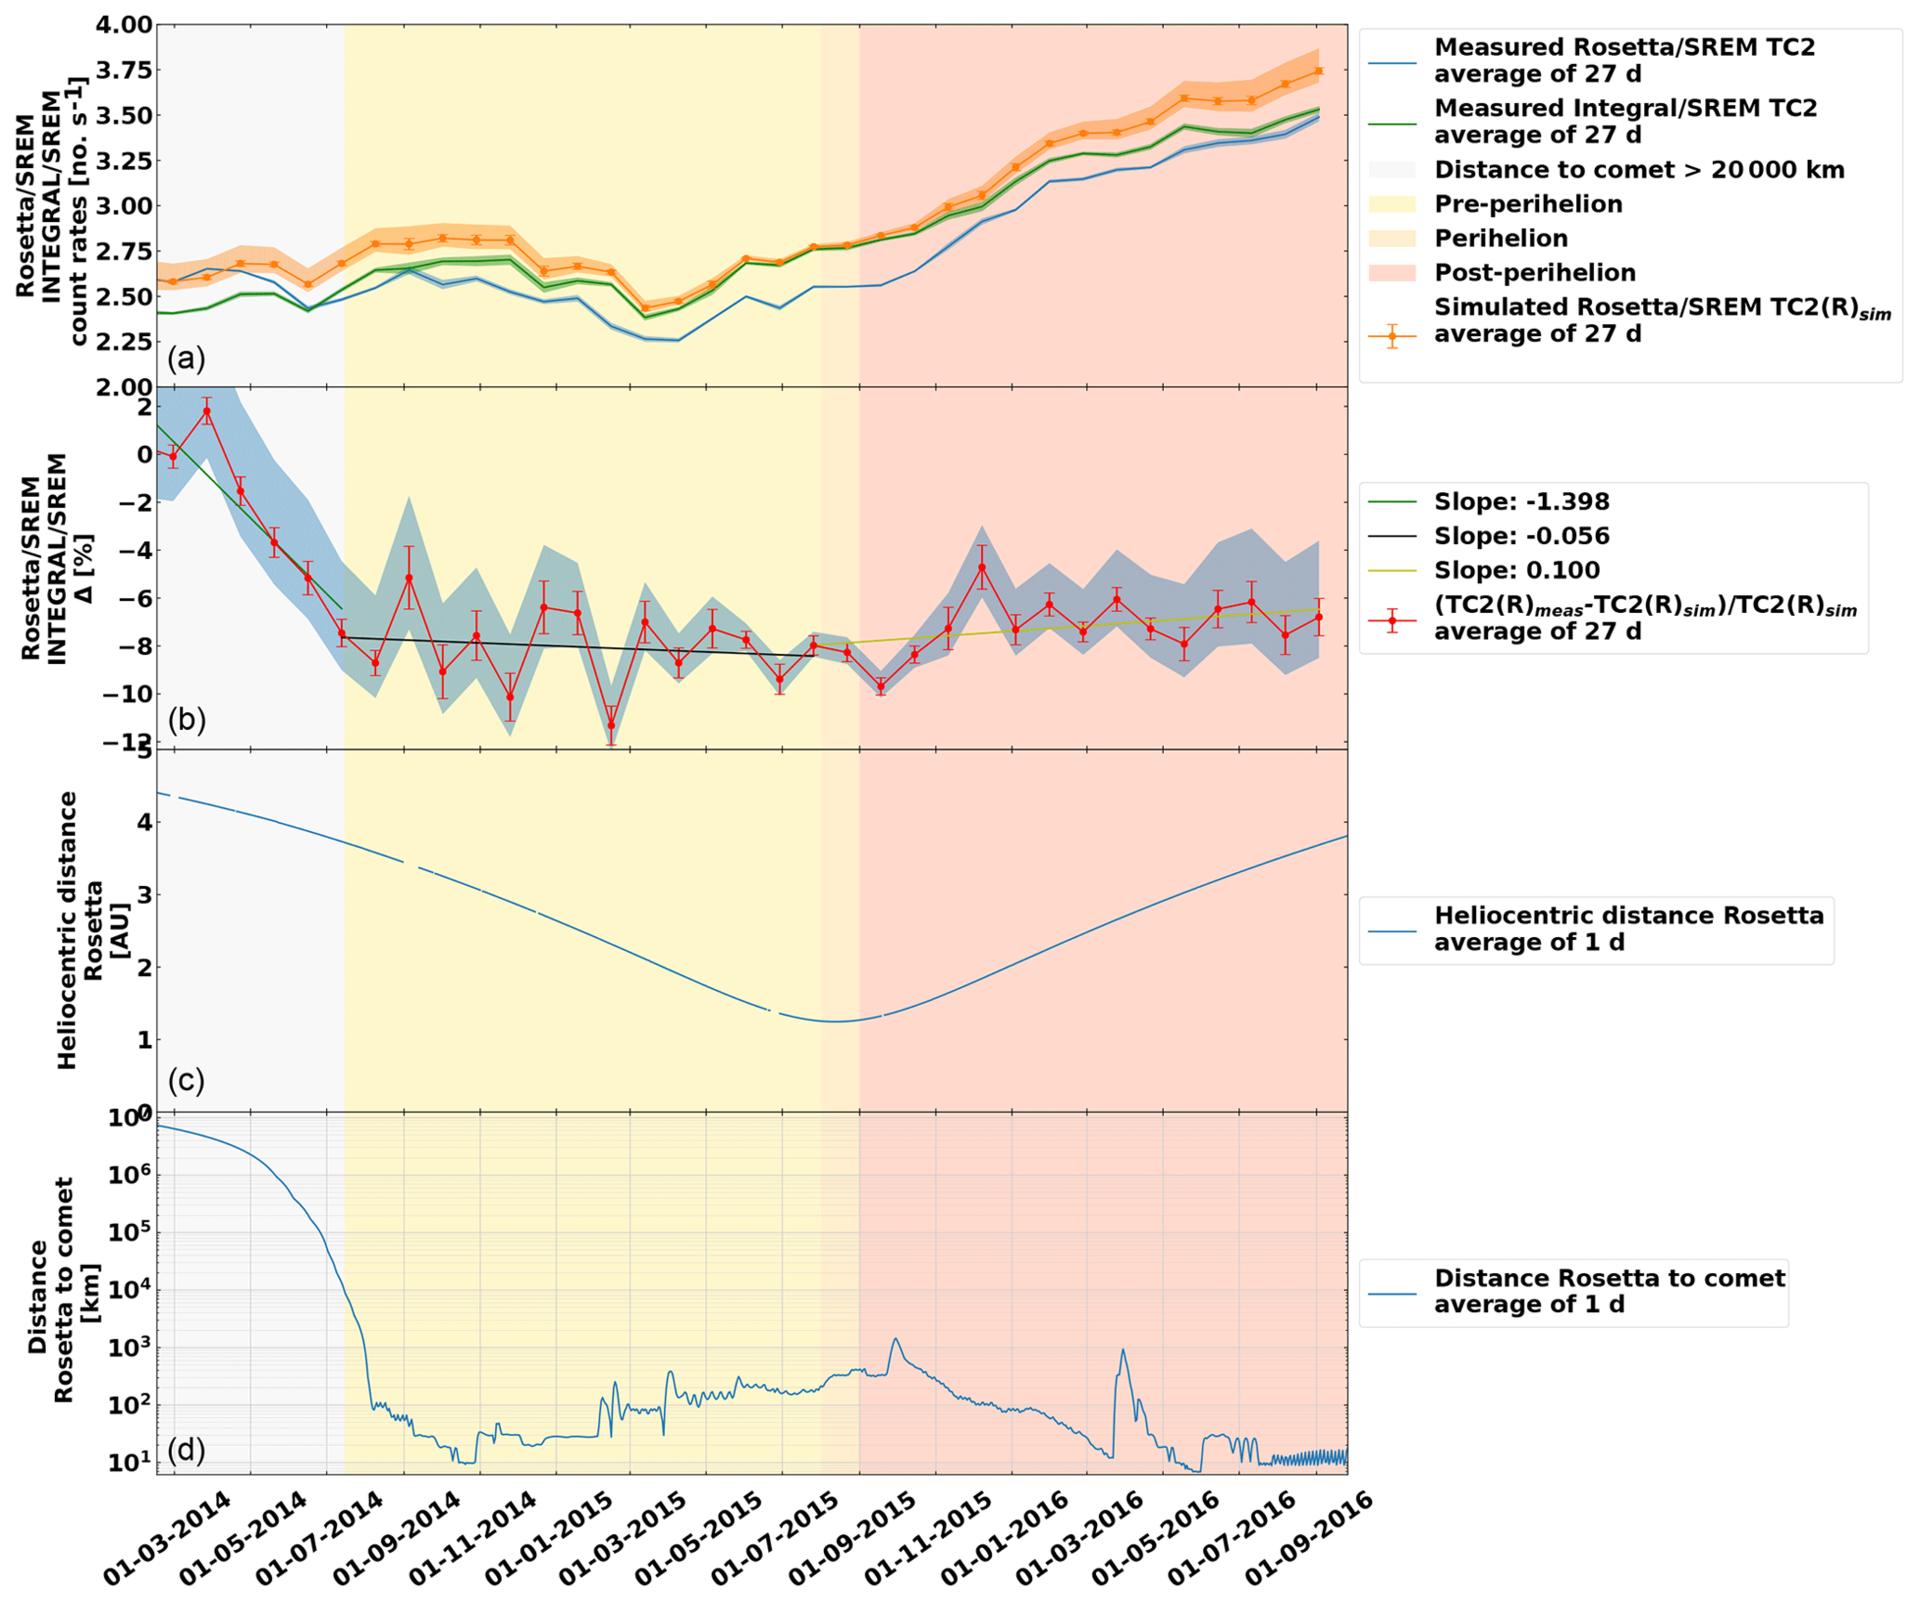
Comparing Rosetta and Integral SREM results
(a) Integral SREM data and measured and simulated Rosetta SREM data. (b) Computed GCR absorption. (c) Rosetta heliocentric distance. (d) Rosetta-to-nucleus distance. Colours in the background from left to right indicate different stages: when the Rosetta-to-comet distance was above 20 000 km (grey), the pre-perihelion phase (light yellow), the perihelion phase (darker yellow), and the post-perihelion phase (light red).