
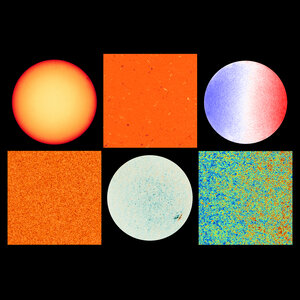
PHI's velocity map of the Sun's surface
This velocity map, also called a ‘tachogram', shows the line-of-sight speed and direction of movement of material at the Sun's visible surface. Blue regions are moving towards the spacecraft and red regions are moving away. It was measured by the Polarimetric and Helioseismic Imager (PHI) onboard the Solar Orbiter spacecraft on 22 March 2023.
While the map clearly shows the Sun's rotation about its axis, it also shows how material is flung out around sunspots. These sunspots are caused by magnetic fields breaking through the visible surface (photosphere) of the Sun.
The major flow pattern in sunspots is called the Evershed flow, seen in the ring around the centre of the sunspots and is always directed radially outwards from spot centre. There are both red and blue patches in the Solar Orbiter image because of the spacecraft's viewing angle. Depending on the location of the spot with respect to the spacecraft, material is flowing either away from the line of sight of the PHI instrument, or towards it.
Assembled from multiple high-resolution images taken by the PHI instrument, the diameter of the Sun's disc is spanned by around 8000 pixels. It is one image of a set of four, representing the first high-resolution full-disc views of the Sun from PHI and an image of the Sun's corona taken by Solar Orbiter's Extreme Ultraviolet Imager (EUI).
Sunlight, magnetic fields and movement revealed by t…

Mercury transit and sunspots

PHI's view of the Sun in visible light
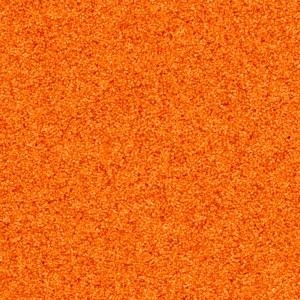
The Sun’s granulation pattern viewed by Solar Orbiter
