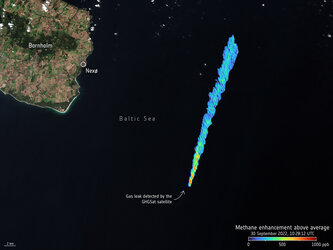
Nord Stream gas leak emissions modelled
The methane emitted in 2022 by the damaged Nord Stream gas pipelines were potentially more than double the volume estimated at the time, according to a study published in Nature. This graph represents net atmospheric emissions (NAE) according to two types of model (the models are: PBREAK, a mathematical model used to simulate the outflow of gas following the sudden puncture or rupture of a high-pressure transmission pipeline, and CATHARE, a tool for thermal hydraulic simulations of multiphase flows).
The models show the accumulated volume of methane emitted from the ruptured pipelines between 26 September and 4 October 2022. The models use datasets from satellite data, as well as observations from land, sea and air.
The two modelled methane volumes are compared with individual observations – referred to as inversions. One is from the Infrared Atmospheric Sounding Interferometer (IASI) instrument on Eumetsat’s MetOp-B satellite. It is referred to as an inversion because the satellite data is extrapolated to give a measurement for the whole air column. Other inversions included in the graph use data from tall towers.
The total methane emissions from the Aliso Canyon leak in the US (in 2015-2016) are also shown for comparison.
Read the full story: Nord Stream methane leak bigger than first estimated