| | | | |
 |
|
Weather Foehn windInteractive MeteosatMeteosat imagesClimate African climateEl NiñoGulf StreamHimalayan climateExplore the world and its climate with JP ExplorerLake Chad
| | | | | | | Exercise 2: Sea surface height
Warm currents such as the Gulf Stream experience great variations of sea surface height (SSH). With the help of satellites we can collect image time series that allow us to observe the current's behaviour through different time periods.
As mentioned previously, the sea surface height fluctuates through the different seasons due to thermal expansion and contraction, but other factors such as the wind and tides also contribute to its variation. In order to be able to quantify how the sea surface height changes, we have to take a reference level from which to measure it. This reference level is called the ‘geoid’, and it represents the sea surface height when no external factors are taken into consideration. Its shape is determined by the different distribution of gravity around the world.
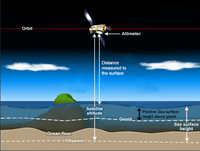
| | Simplified illustration of Satellite Altimetry components | |
Altimetry is the technique used to provide sea level measurements, with the help of active radar sensors called altimeters. Radar altimeters emit regular microwave radiation pulses towards the surface. This signal is then reflected and collected by the sensor. The altimeter registers the time it takes for the emitted beam to come back to the sensor, as well as the magnitude of the pulse.
With this information the sensor is able to compute the sea surface height by subtracting the distance measured to the water surface,from the known altitude of the satellite’s orbit above the Ellipsoid (reference level). The sea surface can then be expressed in terms of its position with respect to the geoid (sea surface height above the geoid). A negative value will mean it is lower than the geoid, whereas a positive value will mean it is higher than the geoid.
In order to obtain good quality results, different altimeter data can be combined. Once again, composites of multi-sensor images can provide the perfect balance between spatial and temporal resolution. The monthly composite images provided for the following exercise are multi-sensor images collected by the Poseidon-2 altimeter on the Jason-1 mission, and Envisat’s Radar Altimeter 2 (RA-2).
LEOWorks exercise
Open one of the SSH images provided (in GulfStream.zip file).
1. Examine the SSH image and its scale. What do the negative values in the scale represent? Which oceanic current is tracing the 'boundary’ between water below and water above the geoid?
2. Take a look at the water with negative values. Why is this water at such low levels compared to the water in the North Atlantic Gyre?
Now make an animation with the series of SSH data provided from July 2011 to July 2012. Observe how the sea surface height varies throughout the year.
Open Tools/Animation. Add the images and choose a suitable animation speed.
3. Examine the image time series. Where do we find the maximum heights of the North Atlantic?
4. During which season does the sea surface height in the Gulf Stream seem to decrease? If a decrease in the sea height is related to the contraction of the water column due to low temperatures, why doesn’t it appear lowest during the month of December?
5. Search for the latest SSH image of the Gulf Stream. Compare it with the time series provided and describe any differences and/or similarities you can identify.
| |
| | The Gulf Stream IntroductionBackground The North Atlantic GyreSea surface currentsExercises Exercise 1: Sea surface temperatureExercise 3: EddiesEduspace - Software LEOWorks 4 (MacOS)LEOWorks 4 (Linux)LEOWorks 4 (Windows)Eduspace - Download GulfStream.zip
|