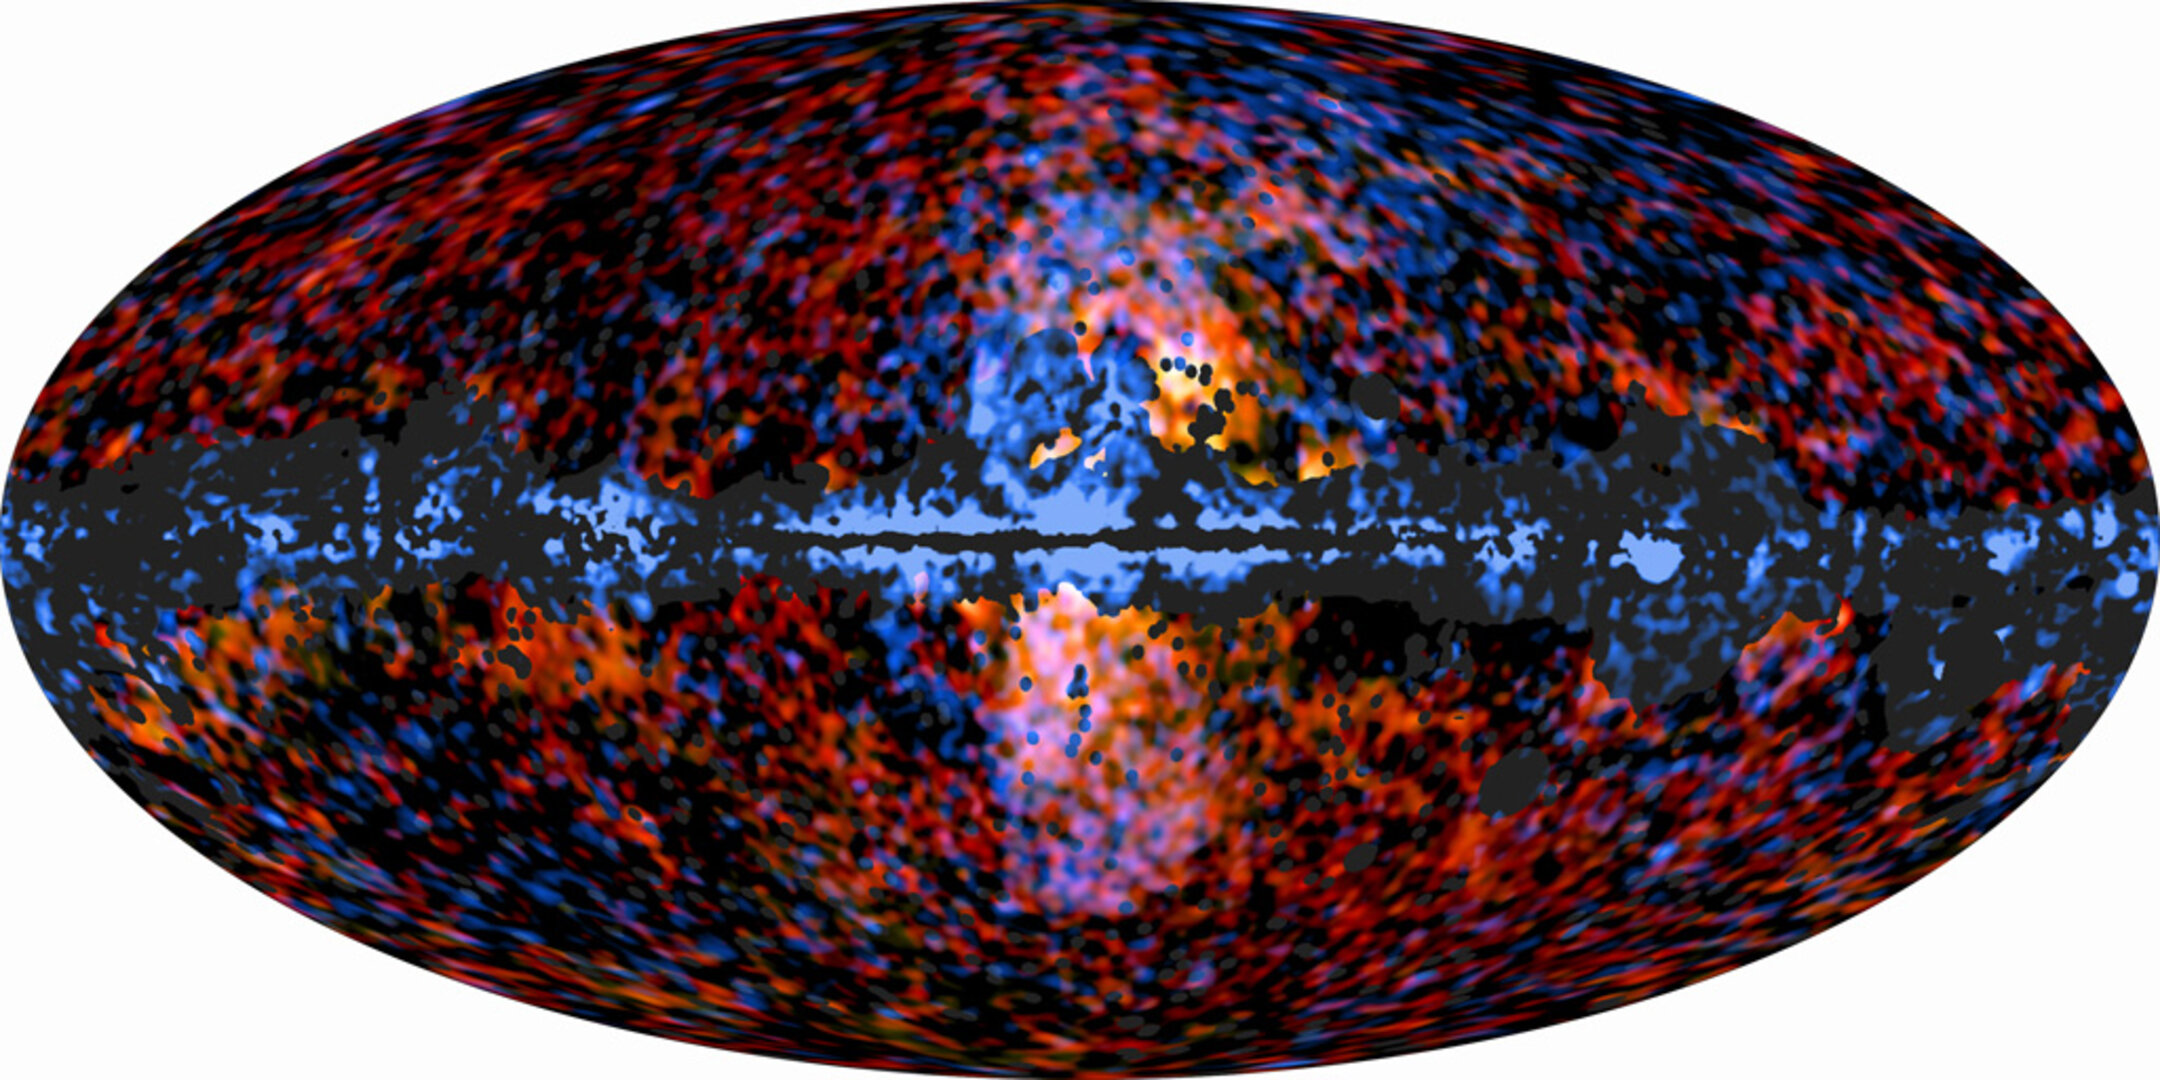
• → European Space Agency

      • Space for Europe
      • Space News
      • Space in Images
      • Space in Videos
    • About Us

      • Welcome to ESA
      • DG's News and Views
      • For Member State Delegations
      • Business with ESA
      • ESA Exhibitions
      • ESA Publications
      • Careers at ESA
    • Our Activities

      • Space News
      • Observing the Earth
      • Human Spaceflight
      • Launchers
      • Navigation
      • Space Science
      • Space Engineering
      • Operations
      • Technology
      • Telecommunications & Integrated Applications
    • For Public

    • For Media

    • For Educators

    • For Kids

    • ESA

    • Space Science

    • [1/6] The microwave sky as seen by Planck
    • [2/6] Planck first light survey
    • [3/6] Planck investigates the cosmic infrared background
    • [4/6] All-sky image of molecular gas seen by Planck
    • [5/6] The mysterious Galactic Haze seen by Planck
    • [6/6] Galactic Haze seen by Planck and Galactic 'bubbles' seen by Fermi

    The microwave sky as seen by Planck
    The microwave sky as seen by Planck

    The microwave sky as seen by Planck. This multi-frequency all-sky image of the microwave sky has been composed using data from Planck covering the electromagnetic spectrum from 30 GHz to 857 GHz.

    The mottled structure of the CMBR, with its tiny temperature fluctuations reflecting the primordial density variations from which today’s cosmic structure originated, is clearly visible in the high-latitude regions of the map. The central band is the plane of our Galaxy. A large portion of the image is dominated by the diffuse emission from its gas and dust.

    The image was derived from data collected by Planck during its first all-sky survey and comes from observations taken between August 2009 and June 2010. This image is a low- resolution version of the full data set.

    To the right of the main image, below the plane of the Galaxy, is a large cloud of gas in our Galaxy. The obvious arc of light surrounding it is Barnard’s Loop – the expanding bubble of an exploded star. Planck has seen whole other galaxies. The great spiral galaxy in Andromeda, 2.2 million light-years from Earth, appears as a sliver of microwave light, released by the coldest dust in its giant body. Other, more distant, galaxies with supermassive black holes appear as single points of microwaves dotting the image.

    Credits: ESA/ LFI & HFI Consortia
    Planck first light survey
    Planck first light survey

    A map of the sky at optical wavelengths shows a prominent horizontal band which is the light shining from our own Milky Way. The superimposed strip shows the area of the sky mapped by Planck during the First Light Survey.

    The colour scale indicates the magnitude of the deviations of the temperature of the Cosmic Microwave Background from its average value, as measured by Planck at a frequency close to the peak of the CMB spectrum (red is hotter and blue is colder).

    The large red strips trace radio emission from the Milky Way, whereas the small bright spots high above the galactic plane correspond to emission from the Cosmic Microwave Background itself.

    Credits: ESA, LFI & HFI Consortia. Background optical image: Axel Mellinger
    Planck investigates the cosmic infrared background
    Planck investigates the cosmic infrared background

    This image shows the location of the first six fields used to detect and study the Cosmic Infrared Background. The fields, named N1, AG, SP, LH2, Boötes 1 and Boötes 2, respectively, are all located at a relatively high galactic latitude, where the foreground contamination due to the Milky Way's diffuse emission is less dramatic.

    Credits: ESA/Planck Collaboration
    All-sky image of molecular gas seen by Planck
    All-sky image of molecular gas seen by Planck

    This all-sky image shows the distribution of carbon monoxide (CO), a molecule used by astronomers to trace molecular clouds across the sky, as seen by Planck.

    Molecular clouds, the dense and compact regions throughout the Milky Way where gas and dust clump together, represent one of the sources of foreground emission seen by Planck. The vast majority of gas in these clouds consists of molecular hydrogen (H2), and it is in these cold regions that stars are born. Since cold H2 does not easily radiate, astronomers trace these cosmic cribs across the sky by targeting other molecules, which are present there in very low abundance but radiate quite efficiently. The most important of these tracers is carbon monoxide (CO), which emits a number of rotational emission lines in the frequency range probed by Planck's High Frequency Instrument (HFI).

    Emission lines affect a very limited range of frequencies compared to the broad range to which each of Planck’s detectors is sensitive, and are usually observed using spectrometers. But some CO lines are so bright that they actually dominate the total amount of light collected by certain detectors on Planck when they are pointed towards a molecular cloud.

    This is the first all-sky map of CO ever compiled. The largest CO surveys thus far have concentrated on mapping the full extent of the Galactic Plane, where most clouds are concentrated, leaving large areas of the sky unobserved.

    The CO map compiled with Planck shows concentrations of molecular gas in portions of the sky that have not been observed before, such as at high galactic latitudes, where clouds that are relatively close to the Solar System might be projected on the all-sky map. Planck's high sensitivity to CO also means that even very low-density clouds can be detected, and new details can be revealed in clouds that were already known.

    Follow-up observations and further studies of these stellar nurseries will allow a detailed investigation of the physical and chemical conditions that lead to the formation of molecular clouds, shedding new light on the very early phases of star formation.

    Credits: ESA/Planck Collaboration
    The mysterious Galactic Haze seen by Planck
    The mysterious Galactic Haze seen by Planck

    This all-sky image shows the spatial distribution over the whole sky of the Galactic Haze at 30 and 44 GHz, extracted from the Planck observations. In addition to this component, other foreground components such as synchrotron and free-free radiation, thermal dust, spinning dust, and extragalactic point sources contribute to the total emission detected by Planck at these frequencies. The prominent empty band across the plane of the Galaxy corresponds to the mask that has been used in the analysis of the data to exclude regions with strong foreground contamination due to the Galaxy's diffuse emission. The mask also includes strong point-like sources located over the whole sky.

    The Galactic Haze is seen to be distributed around the Galactic Centre and its spectrum is similar to that of synchrotron emission. However, compared to the synchrotron emission seen elsewhere in the Milky Way, the Galactic Haze has a 'harder' spectrum, meaning that its emission does not decline as rapidly with increasing frequency. Diffuse synchrotron emission in the Galaxy is interpreted as radiation from highly energetic electrons that have been accelerated in shocks created by supernova explosions.

    Several explanations have been proposed for the unusual shape of the Haze’s spectrum, including enhanced supernova rates, galactic winds and even annihilation of dark-matter particles. Thus far, none of them have been confirmed and the issue remains open.

    Credits: ESA/Planck Collaboration
    Galactic Haze seen by Planck and Galactic 'bubbles' seen by Fermi
    Galactic Haze seen by Planck and Galactic 'bubbles' seen by Fermi

    This all-sky image shows the distribution of the Galactic Haze seen by ESA's Planck mission at microwave frequencies superimposed over the high-energy sky as seen by NASA's Fermi Gamma-ray Space Telescope.

    The Planck data (shown here in red and yellow) correspond to the Haze emission at frequencies of 30 and 44 GHz, extending from and around the Galactic Centre.

    The Fermi data (shown here in blue) correspond to observations performed at energies between 10 and 100 GeV and reveal two bubble-shaped, gamma-ray emitting structures extending from the Galactic Centre.

    The two emission regions seen by Planck and Fermi at two opposite ends of the electromagnetic spectrum correlate spatially quite well and might indeed be a manifestation of the same population of electrons via different radiation processes.

    Synchrotron emission associated with the Galactic Haze seen by Planck exhibits distinctly different characteristics from the synchrotron emission seen elsewhere in the Milky Way. Diffuse synchrotron emission in the Galaxy is interpreted as radiation from highly energetic electrons that have been accelerated in shocks created by supernova explosions. Compared to this well-studied emission, the Galactic Haze has a 'harder' spectrum, meaning that its emission does not decline as rapidly with increasing frequency.

    Several explanations have been proposed for this unusual behaviour, including enhanced supernova rates, galactic winds and even annihilation of dark-matter particles. Thus far, none of them have been confirmed and the issue remains open.

    The Planck image includes the mask that has been used in the analysis of the data to exclude regions with strong foreground contamination due to the Galaxy's diffuse emission. The mask also includes strong point-like sources located over the whole sky.

    Credits: ESA/Planck Collaboration (microwave); NASA/DOE/Fermi LAT/Dobler et al./Su et al. (gamma rays)

    Planck's Universe

    All-sky surveys from ESA's Planck space telescope

    Access the image

    Access the image

    Access the image

    Access the image

    Access the image

    Access the image

    Rate this

    Views

    Share

    • Currently 5 out of 5 Stars.
    • 1
    • 2
    • 3
    • 4
    • 5
    Rating: 5/5 (3 votes cast)

    Thank you for rating!

    You have already rated this page, you can only rate it once!

    Your rating has been changed, thanks for rating!

    320
    facebook
    twitter
    reddit
    google plus
    digg
    tumbler
    digg
    blogger
    myspace

    Connect with us

    • RSS
    • Youtube
    • Twitter
    • Flickr
    • Google Buzz
    • Subscribe
    • App Store
    • ESA Science Twitter

    Follow ESA science

    • LATEST ARTICLES
    • · CryoSat hits land
    • · Ariane 5 completes seven launches …
    • · Measuring skull pressure without t…
    • · Malargüe station inauguration
    • · The solar wind is swirly
    • FAQ

    • Jobs at ESA

    • Site Map

    • Contacts

    • Terms and conditions