Arctic summer ice anomaly shocks scientists
Satellite images acquired from 23 to 25 August 2006 have shown for the first time dramatic openings – over a geographic extent larger than the size of the British Isles – in the Arctic’s perennial sea ice pack north of Svalbard, and extending into the Russian Arctic all the way to the North Pole.
Observing data from Envisat’s Advanced Synthetic Aperture Radar (ASAR) instrument and the AMSR-E instrument aboard the EOS Aqua satellite, scientists were able to determine that around 5-10 percent of the Arctic’s perennial sea ice, which had survived the summer melt season, has been fragmented by late summer storms. The area between Spitzbergen, the North Pole and Severnaya Zemlya is confirmed by AMSR-E to have had much lower ice concentrations than witnessed during earlier years.
Mark Drinkwater of ESA’s Oceans/Ice Unit said: “This situation is unlike anything observed in previous record low ice seasons. It is highly imaginable that a ship could have passed from Spitzbergen or Northern Siberia through what is normally pack ice to reach the North Pole without difficulty.
"If this anomaly trend continues, the North-East Passage or ‘Northern Sea Route’ between Europe and Asia will be open over longer intervals of time, and it is conceivable we might see attempts at sailing around the world directly across the summer Arctic Ocean within the next 10-20 years."
During the last 25 years, satellites have been observing the Arctic and have witnessed reductions in the minimum ice extent – the lowest amount of ice recorded in the area annually – at the end of summer from around 8 million km² in the early 1980s to the historic minimum of less than 5.5 million km² in 2005, changes widely viewed as a consequence of greenhouse warming.

Satellite observations in the past couple of years have also shown that the extent of perennial ice is rapidly declining, but this strange condition in late August marks the first time the perennial ice pack appears to exhibit thinner and more mobile conditions in the European sector of the Central Arctic than in earlier years.
Both sets of images were taken by two different satellite instruments – ASAR on the left and AMSR-E on the right. In the coloured AMSR-E images, ice cover, or the concentration of ice, is represented by the colour. Pink represents pack ice and the colour blue open water. Intermediate colours orange, yellow, and green indicate lower ice concentrations of 70%, 50% and 30%, respectively. In the ASAR images, ice cover is represented by the uniform grey area which extends radially-outwards from the North Pole, represented by the central black hole.
The set of images on the top were both acquired on 24 August 2005, while the bottom left ASAR image was acquired on 23 August 2006 and the AMSR-E on 24 August 2006. In 2005, the uniform grey area in the ASAR image and the pink colour in the AMSR-E image are both consistent all the way around the pole (black hole), indicating pack ice with 100% ice concentration.
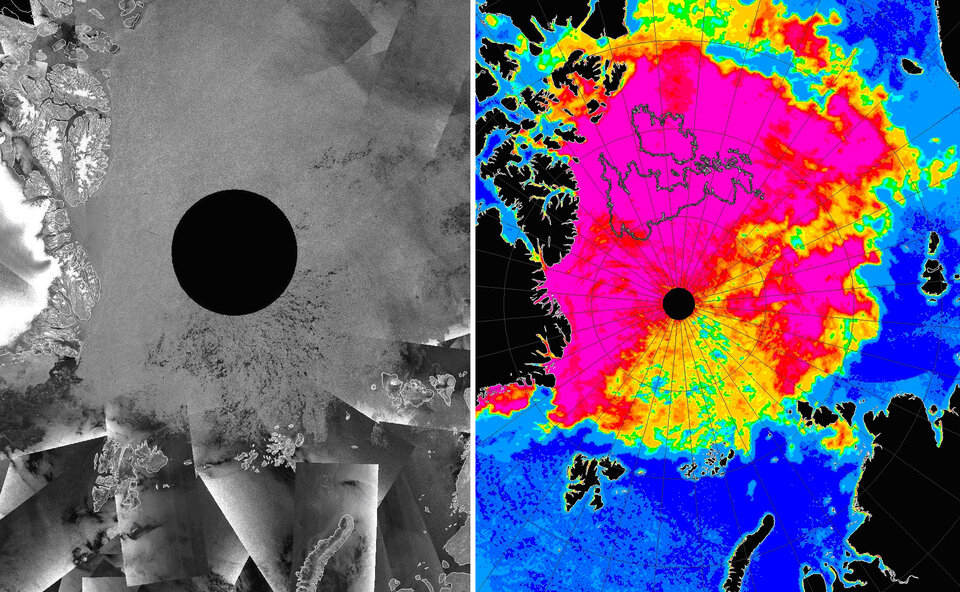
However in 2006 there is a significant extent of leads – fractures and openings in the sea-ice cover – just below the pole in both the ASAR image, seen as splashes of dark grey and black, and the AMSR-E image (with British Isles shown for scale), seen by the high concentration of yellow, orange and green colours, signifying low ice concentrations.
In the last weeks, what was open water has begun to freeze, as the autumn air temperatures over the Arctic begin to fall. Although a considerable fraction of darker leads can still be seen in the area using ASAR, the AMSR-E sensor no longer shows openings.
ASAR is an active microwave instrument which sends periodic radar pulses toward the Earth and measures the signals return. AMSR-E is a passive microwave instrument which does not send radar pulses down but receives radiation naturally emitted from the Earth. Passive microwave data contain a certain amount of ambiguity in interpretation of ice types, particularly in mid summer during melting. However, this ambiguity is removed in high resolution active microwave data.
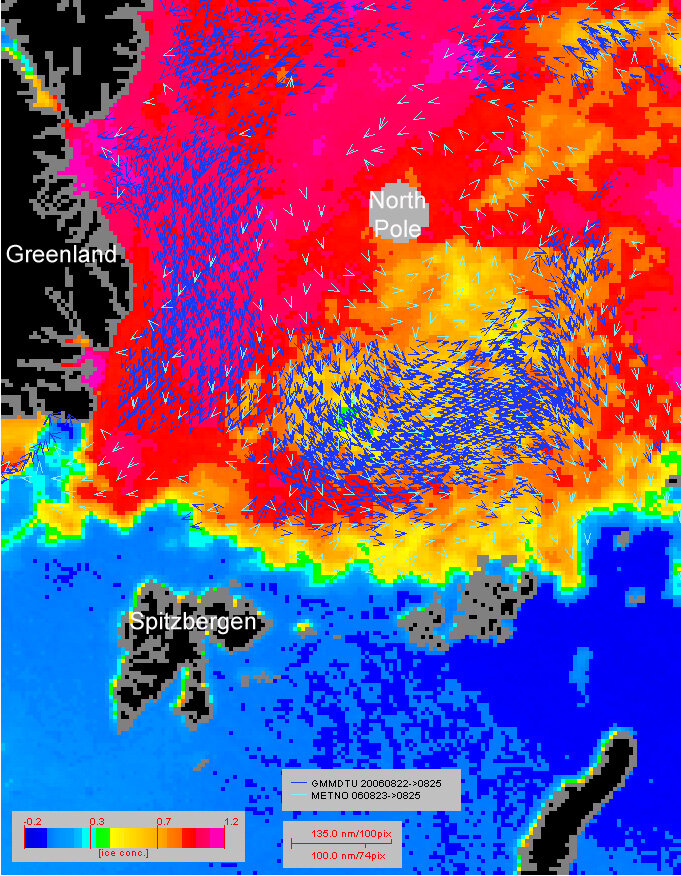
Though the reason for the considerable change in the ice pack configuration is still unknown, it is likely due to the stormy weather conditions in August that characterised the month.
The effect stormy conditions have on ice is illustrated in this ASAR image, taken on 25 August 2006, as the ice in the red circle is divergent as a consequence of a low pressure system centred on the North Pole.
"As autumn freeze-up begins, the current pattern will undoubtedly precondition the ice situation in the Central Arctic for the subsequent ice season," Drinkwater said.