COROT surprises a year after launch
The space-borne telescope, COROT (Convection, Rotation and planetary Transits), has just completed its first year in orbit. The observatory has brought in surprises after over 300 days of scientific observations.
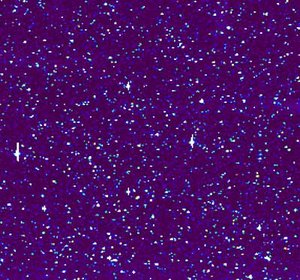
Pioneering precision measurement over long periods of time COROT is observing a large number of stars, up to
The satellite measures variations in the light output of these stars down to one part in a million. This level of precision allows scientists to study the many ways in which stars vary. The pulsations are caused either due to unknown physical processes in the stellar interior, or by objects such as planets passing in front of the stellar surface.
A treasure trove of information for stellar seismology
To date, 30 stars have been observed as part of the study of stellar seismology, the study of the minuscule changes in light output from a star caused by acoustic waves travelling through the star. The pattern of the changes tells us a lot about what is happening deep inside the star. The stars observed by COROT range from objects similar to our own Sun to older or more massive stars. The observation period varies between 20 and 150 days of essentially uninterrupted study.
After a preliminary analysis, the measurements have revealed very exciting results
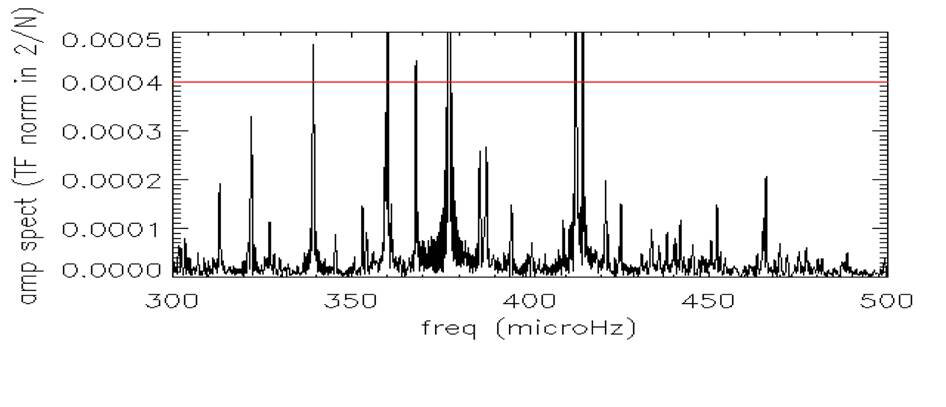
Research into solar-type oscillations is one of the mission’s key objectives. Such oscillations have already been found in two stars that are very similar to our sun - first in HD49933 and then in HD181420. The variations are very weak in amplitude and given their short coherence time (the duration for which a particular wave persists on the stellar surface), they are very hard to detect and measure.
COROT’s discovers its second exoplanet
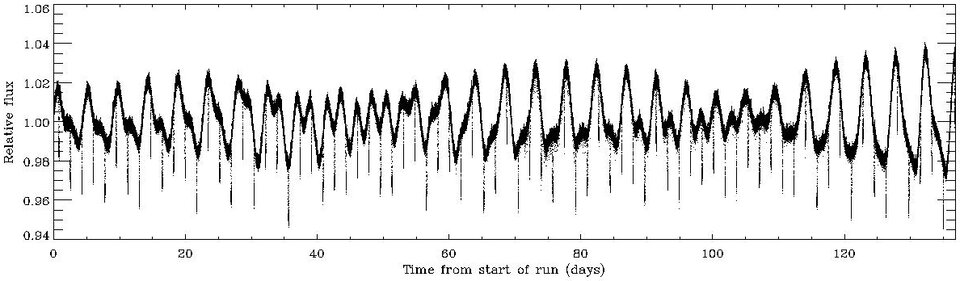
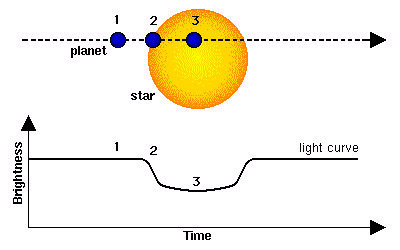
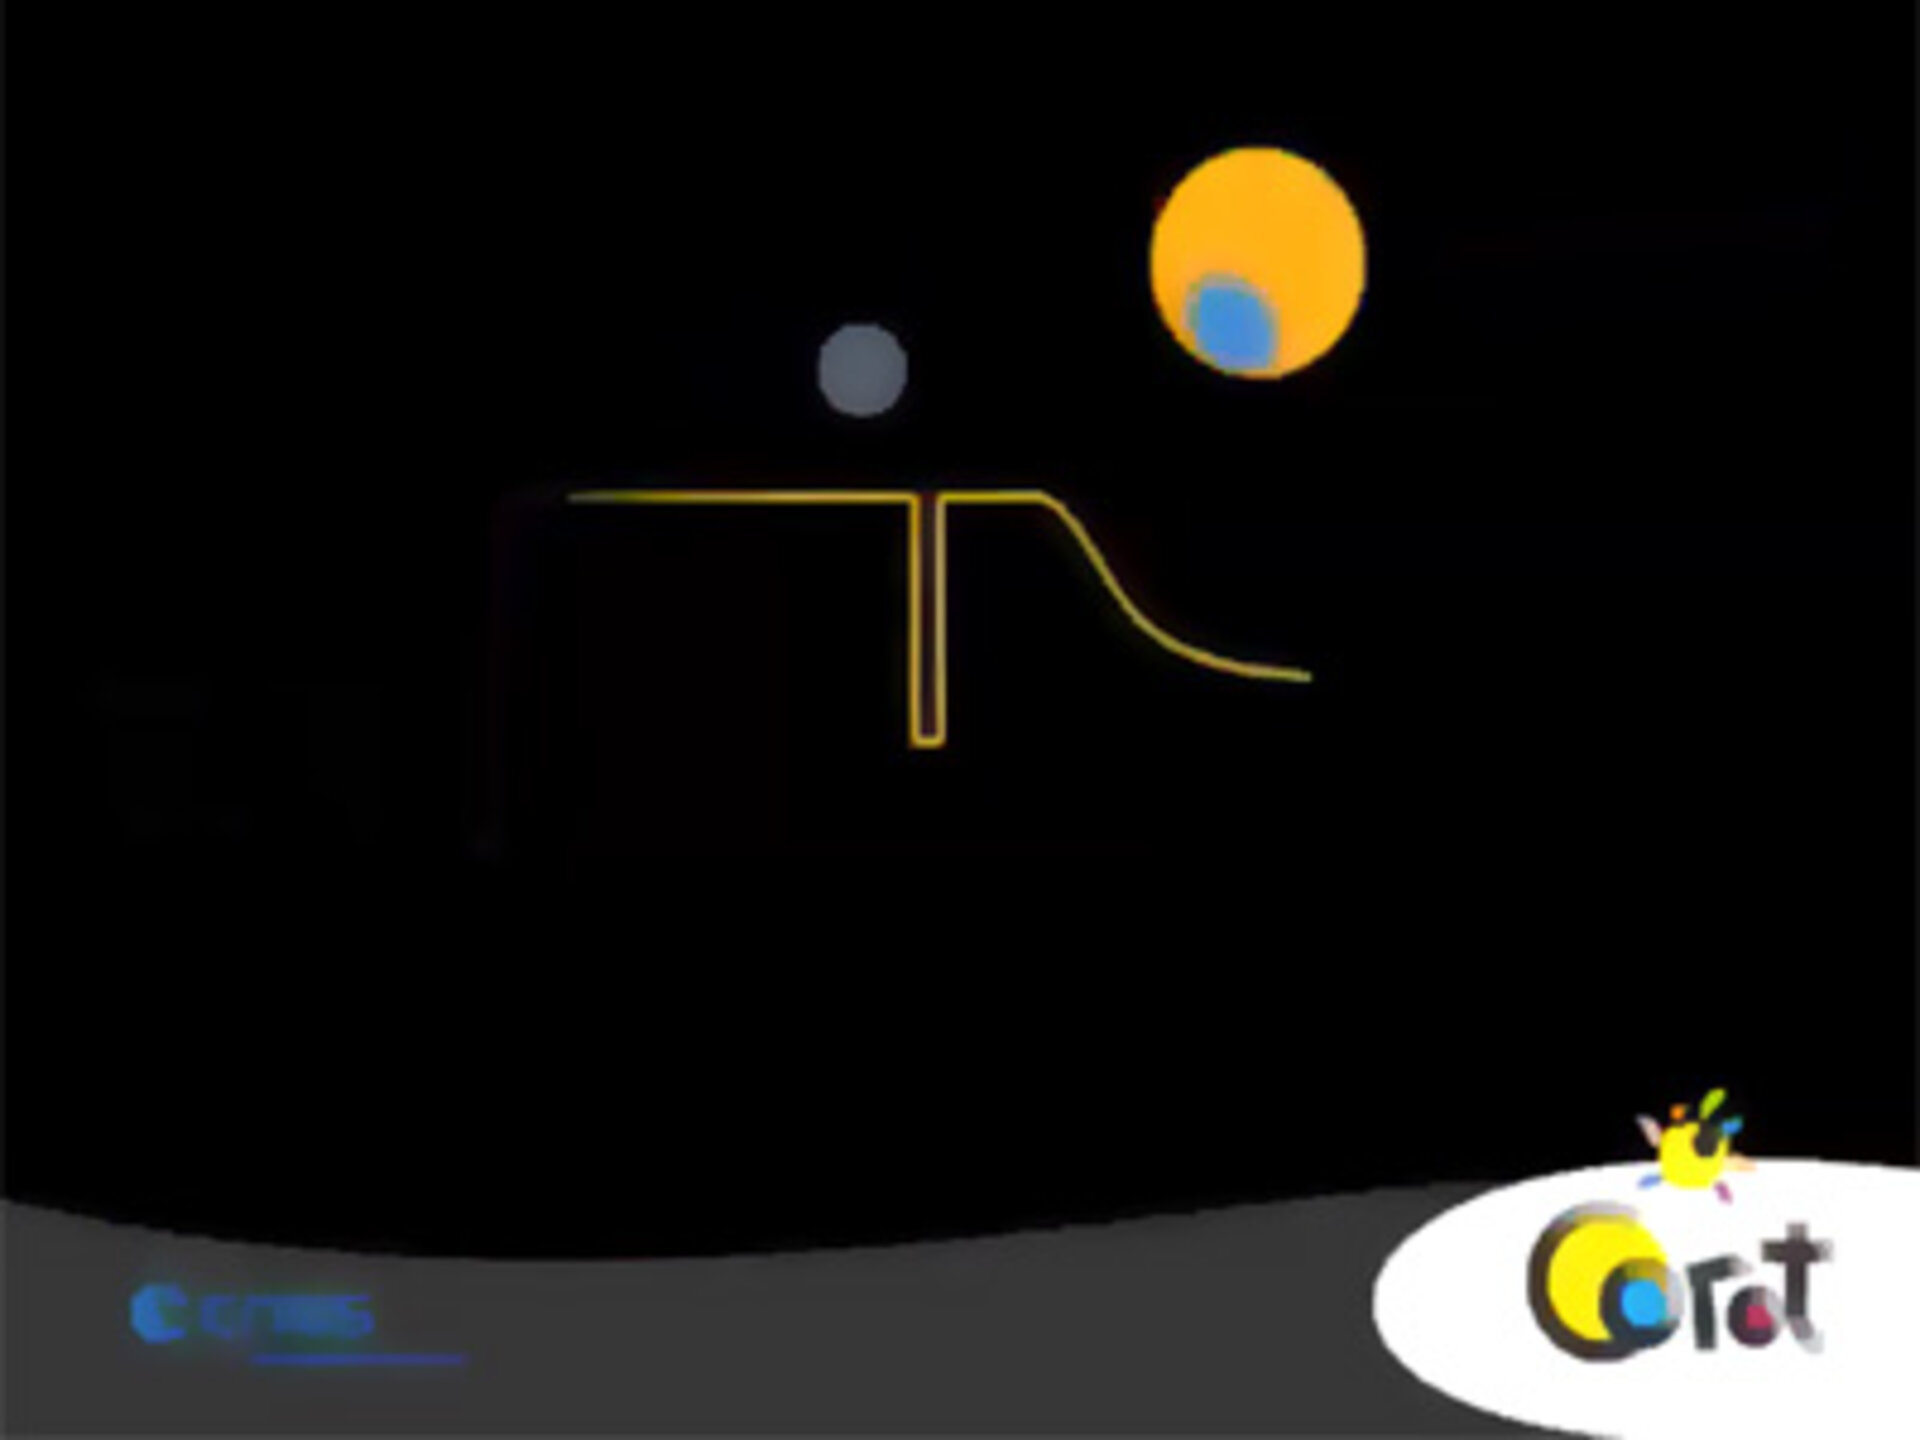
As a planet passes in front of a star, there is a dip in the light output from the star, which is detected by COROT. Since many other processes can mimic the signature observed, to confirm the presence of a planet, a large confirmation programme with supplementary ground-based observations is necessary to prove the existence of a planet.
Although COROT observes thousands of light curves, the pace of discovery is governed by ground-based observations.
In the third sequence of COROT observations, a likely time for the transit of COROT-exo-2b in front of its star was worked out and an analysis of the light curve was carried out in real-time to confirm the find. Observations were carried out simultaneously at the observatory of Haute Provence in France, and at the European Southern Observatory in Chile, confirming the existence of the planet and its mass was measured.
COROT-exo-2b orbits a star similar to our Sun, somewhat more massive and cooler, but more active. It is located about 800 light-years from Earth in the direction of the constellation Serpens. COROT-exo-2b is a giant planet, 1.4 times larger and 3.5 times more massive than Jupiter. Its average density of 1.5 grams per cubic centimetre is also somewhat higher than Jupiter’s. This massive planet orbits its star in a little less than two days from a distance of about six times the stellar radius.
"Christmas is early this year,” for ESA's COROT Project Scientist, Malcolm Fridlund. “The release of the first data set has already had the science team working hard. The quality of the data is fantastic and the results will change both, how we see exoplanets and how we understand stars."
Notes for editors:
During the spring of 2007, COROT discovered its first exoplanet, named COROT-exo-1b.
On 10 December 2007, the first set of data obtained by COROT was released to the Co-Investigators of the mission. These scientists hail from the member states of the COROT consortium (ESA, Austria, Belgium, Brazil, Germany, and Spain). The actual analysis of large amounts of data has just begun and is expected to speed-up with the release of the next data segment in February 2008.
In the data obtained, many light curves show signs of exoplanets in transit and are being followed-up from ground. Within this list of objects which is growing by the day, two candidates stand out as particularly interesting. One planet is half the size of Saturn, and another is the size of Jupiter, but with a very unusual density.
The discovery of COROT-exo-1b and COROT-exo-2b is described in three scientific papers that will be submitted to scientific journals in the next few days.
COROT has observed four regions so far:
- One zone in the direction of the constellation of the Unicorn (Monoceros) for 60 days
- Two regions in the opposite direction on the sky, towards the constellation of the Snake's tail (Serpens Cauda) – one short for 26 days and one long for 150 days.
- A new region in the direction of the Unicorn, where COROT will remain for at least 150 days
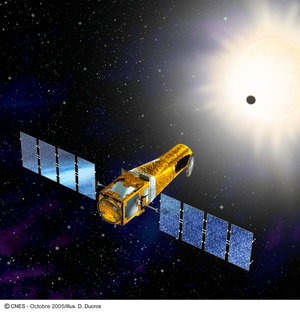
COROT was launched by a Soyuz rocket from the Baikonour cosmodrome in Kazakhstan on 27 December 2006. Settled in its almost-circular polar orbit ranging between 895 and 906 km above Earth's surface, the spacecraft was powered on 2 January 2007 and started its science observations on 3 February this year.
COROT is a CNES project with ESA participation. The other major partners in this mission are Austria, Belgium, Brazil, Germany and Spain.
For more information:
Malcolm Fridlund, ESA COROT Project Scientist
Email: Malcolm.Fridlund @ esa.int