Los satélites muestran cómo se movió la Tierra durante el terremoto de Italia
Estudiando los datos radar de los satélites Envisat de la ESA y COSMO-SkyMed de la Agencia Espacial Italiana, los científicos han empezado a analizar el movimiento de la Tierra durante y después del terremoto de 6.3 grados que sacudió la ciudad medieval de L’Aquila en el centro de Italia el pasado 6 de Abril de 2009.
Científicos del Istituto per il Rilevamento Elettromagnetico dell’ Ambiente (IREA-CNR) y del Istituto Nazionale di Geofisica e Vulcanologia (INGV) están estudiando los datos del Radar de Apertura Sintética (SAR) de estos satélites para trazar un mapa de las deformaciones de la superficie tras el terremoto y las numerosas réplicas que le sucedieron.
Los científicos están empleando una técnica conocida como Interferometría SAR (InSAR), una versión sofisticada de ‘encuentra las diferencias’. La técnica InSAR consiste en combinar dos o más imágenes radar de la misma ubicación de forma que se puedan realizar medidas muy precisas – hasta el orden de unos pocos milímetros – de cualquier movimiento del terreno que haya tenido lugar entre la toma de las distintas imágenes.
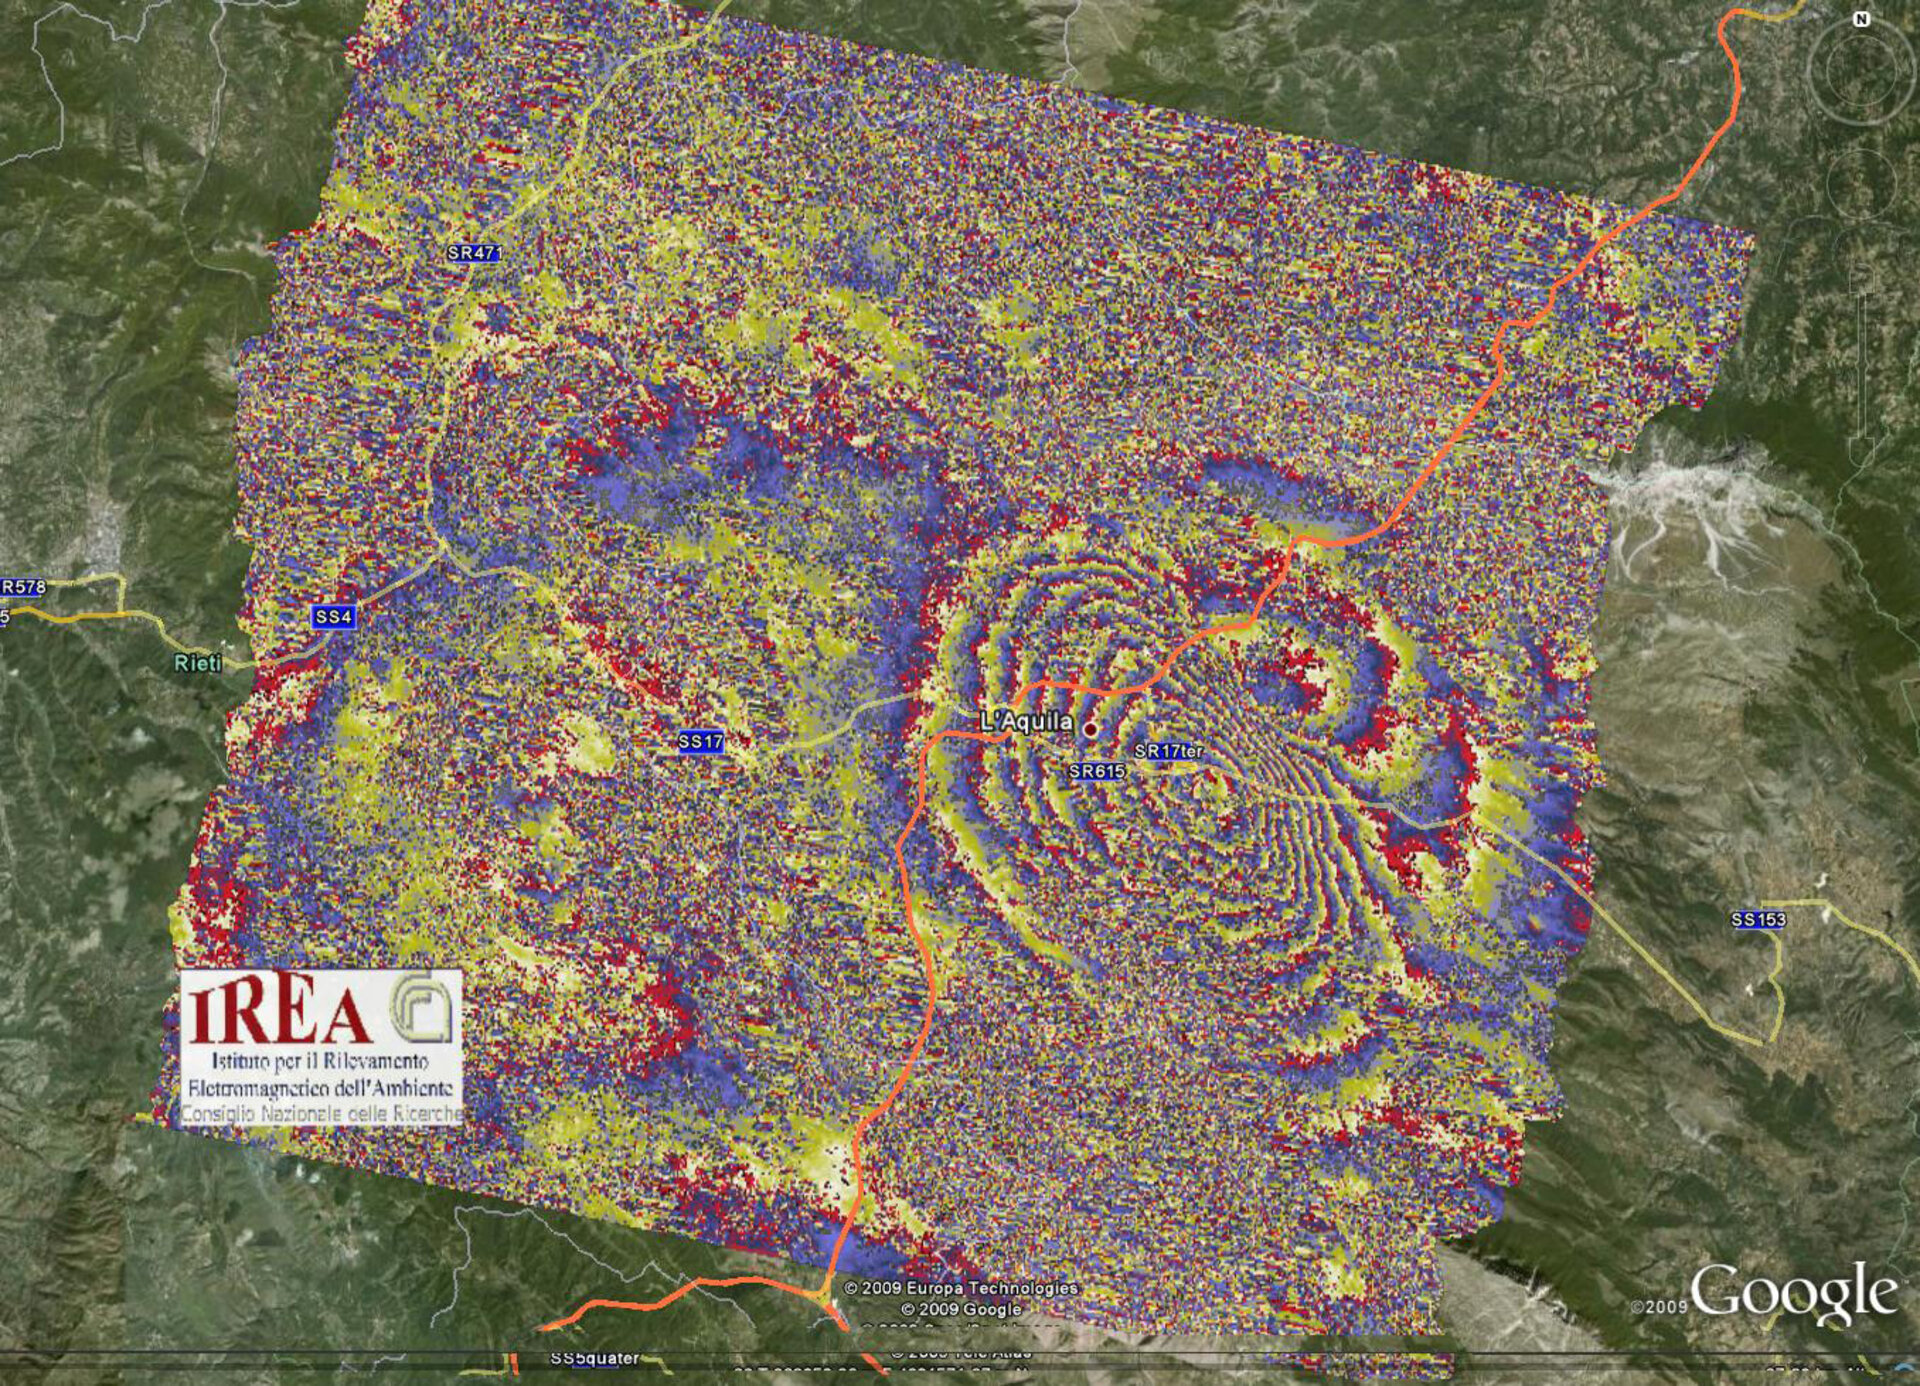
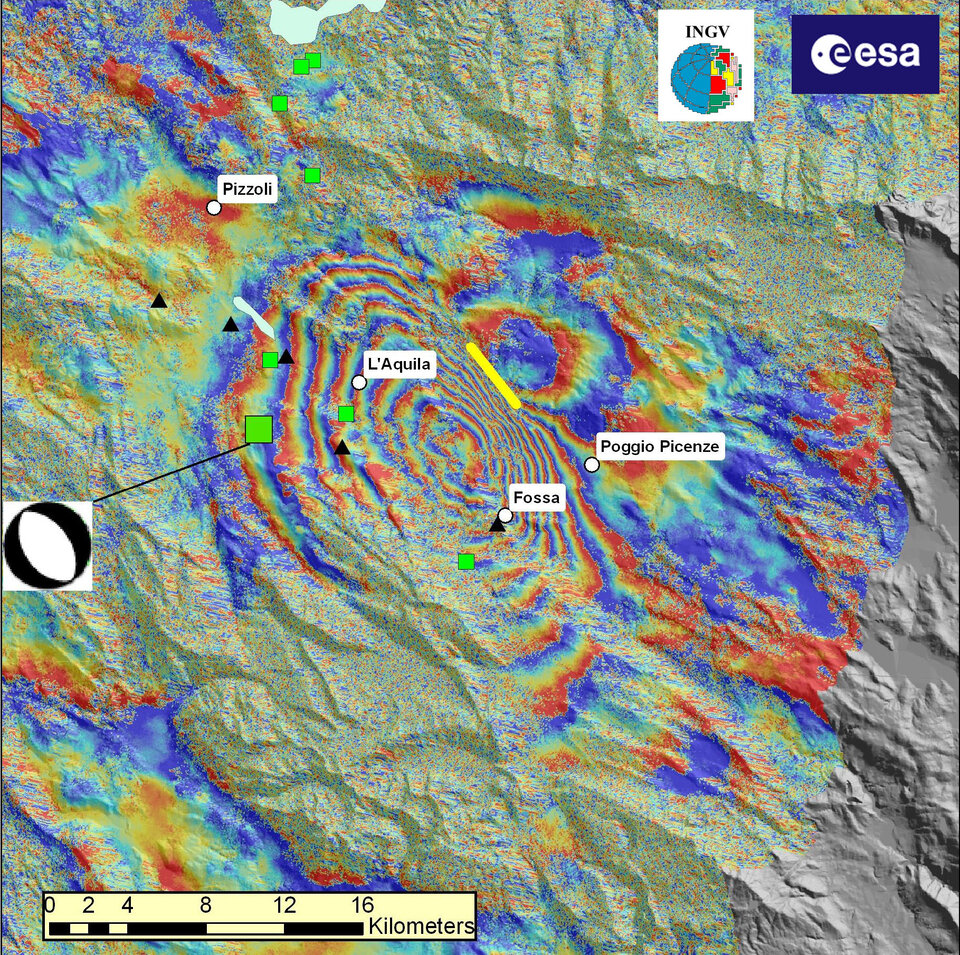
La técnica de InSAR fusiona los datos obtenidos antes y después del terremoto para generar ‘interferogramas’, unas imágenes que aparecen como patrones de interferencia con los colores del arco iris. Cada serie completa de bandas de color, llamadas ‘bordes’, representa un movimiento del terreno relativo al satélite de media longitud de onda, que son 2.8 cm en el caso del ASAR de Envisat.
Los primeros datos de Envisat, obtenidos tras el terremoto el 12 de Abril, se pusieron inmediatamente a disposición de los científicos.

“Preparamos un interferograma tan sólo unas pocas horas después de que Envisat tomara las imágenes combinando estos datos con datos obtenidos antes del terremoto, el 1 de Febrero. Estamos satisfechos de haber podido identificar inmediatamente el patrón del terremoto en el gráfico”, comenta Riccardo Lanari del IREA-CNR en Nápoles, Italia.
El interferograma de Envisat, según la explicación de Stefano Salvi del Grupo de Teledetección de Terremotos de INGV, muestra nueve bordes rodeando un área de máximo desplazamiento localizada a mitad de camino entre L’Aquila y Fossa, donde el suelo se desplazó hasta 25 cm (medidos a lo largo de la línea entre la posición orbital del satélite y la zona del terremoto).
“Utilizando los datos 3D disponibles del desplazamiento del suelo en cinco posiciones GPS alrededor del área afectada, somos capaces de confirmar los resultados preliminares obtenidos con los datos de Envisat”, comentó Salvi.

La constelación COSMO-SkyMed, compuesta actualmente por tres satélites, permite obtener datos con una mayor frecuencia. Esto significa que se podrán calcular nuevos interferogramas cada pocos días.
Los datos de COSMO-SkyMed junto con los datos de Envisat y probablemente datos SAR de otros satélites garantizarán un denso muestreo de la deformación del terreno en la región de L’Aquila en los próximos meses, lo que podría hacer que este terremoto sea uno de los más cubiertos por medidas de Interferometría SAR.
Para asegurar que todos los científicos pueden contribuir al análisis del terremoto, la ESA pone a libre disposición los conjuntos de datos de observación de la Tierra de la región de L’Aquila con un innovador mecanismo de descarga . de alta velocidad. Los conjuntos de datos se actualizarán continuamente con las nuevas imágenes obtenidas por Envisat.