World fire maps now available online in near-real time
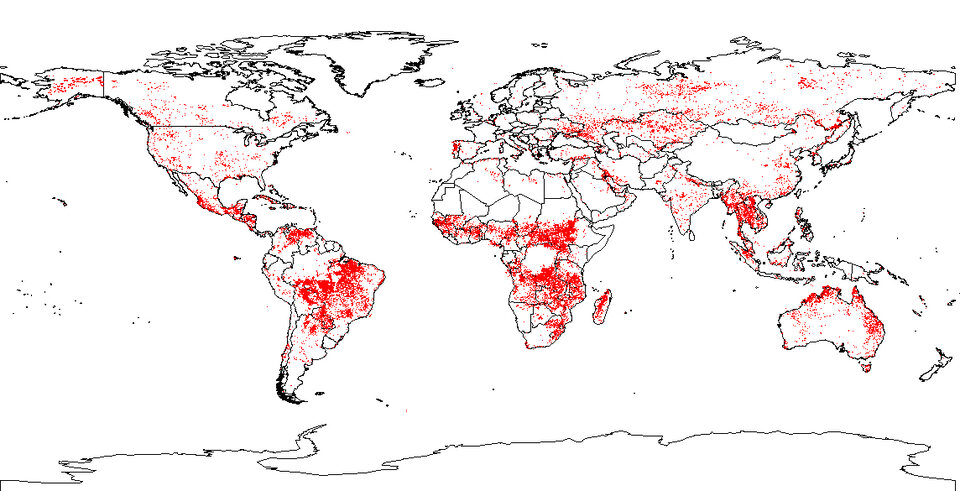
For a decade now, ESA satellites have been continuously surveying fires burning across the Earth’s surface. Worldwide fire maps based on this data are now available to users online in near-real time through ESA's ATSR World Fire Atlas.
The ATSR World Fire Atlas (WFA) – the first multi-year global fire atlas ever developed – provides data approximately six hours after acquisition and represents an important scientific resource because fire is a major agent of environmental change.
"The atlas is an excellent resource that provides a glimpse of the world that was not previously possible, and which is certain to allow ecologists to address both new and old questions regarding the role of fire in structuring the natural world," Matt Fitzpatrick of the University of Tennessee’s Department of Ecology & Evolutionary Biology said.
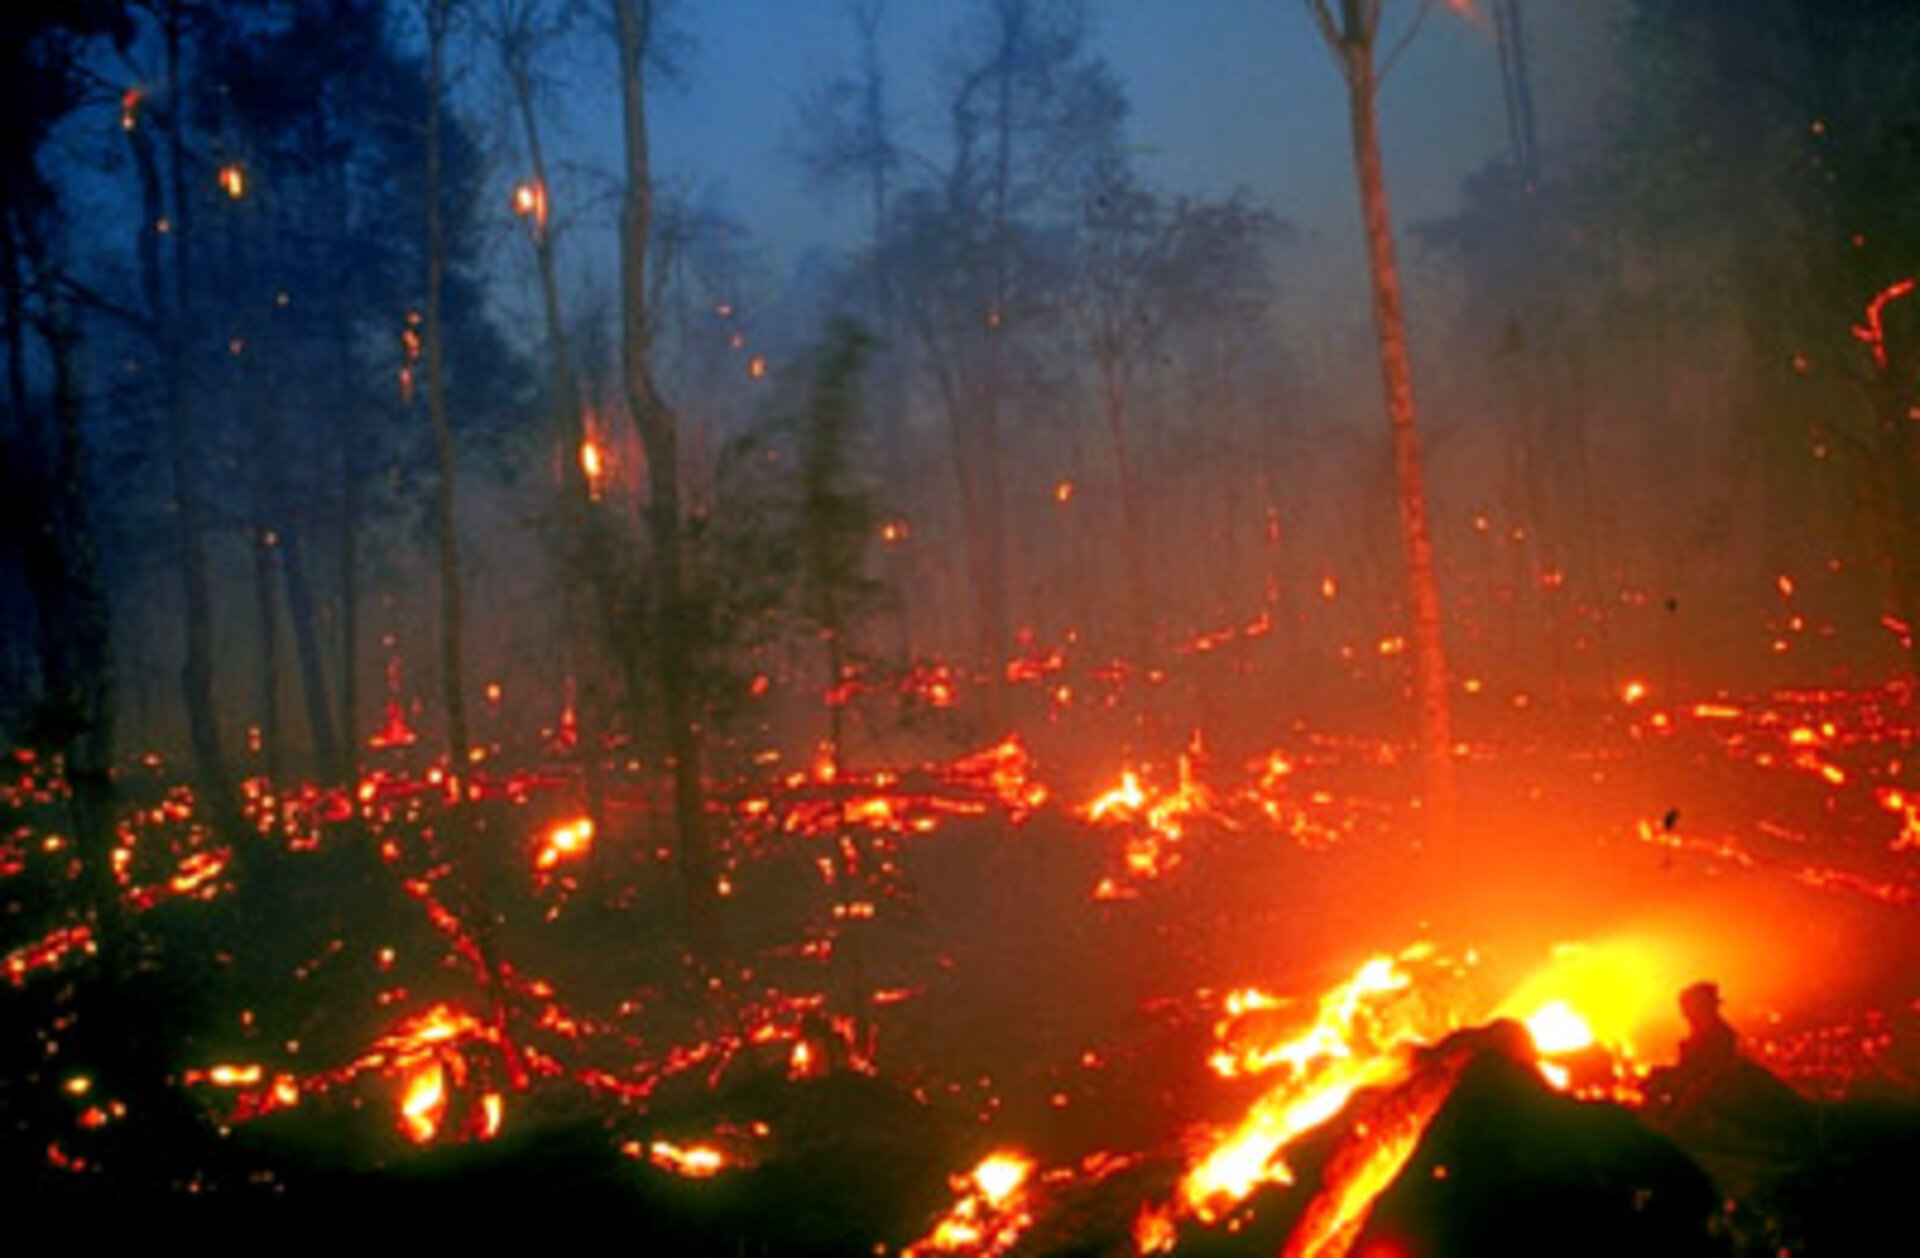
More than 50 million hectares of forest are burnt annually, and these fires have a significant impact on global atmospheric pollution, with biomass burning contributing to the global budgets of greenhouse gases, like carbon dioxide. In the past decade researchers have realised the importance of monitoring this cycle. In fact, WFA data are currently being accessed mostly for atmospheric studies.
Quantifying fire is important for the ongoing study of climate change. The 1998 El Niño, for example, helped encourage fires across Borneo which emitted up to 2.5 billion tonnes of carbon into the atmosphere, equivalent to Europe's entire carbon emissions that year.
There are over 200 registered users accessing the WFA. The data are being used in Europe, Asia, North America, South America, Africa and Australia for research in atmospheric chemistry, land use change, global change ecology, fire prevention and management and meteorology.
Harvard University, University of Toronto, National Centre for Atmosphere and NASA, among others, have used the data in research publications. To date, there are more than 100 scientific publications based on WFA data.
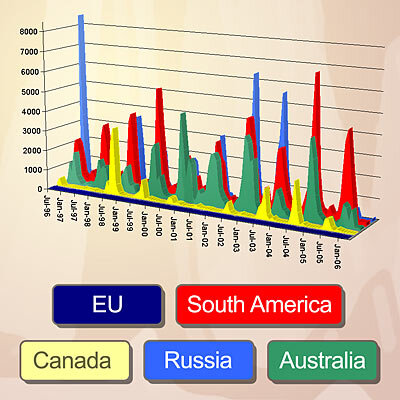
In addition to maps, the time, date, longitude and latitude of the hot spots are provided. The database covers 1995 to present, but complete yearly coverage begins from 1997.
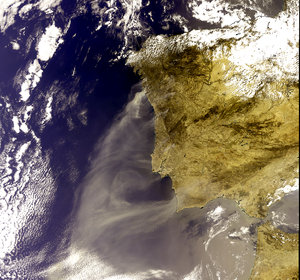
The WFA data are based on results from the Along Track Scanning Radiometer (ATSR) on ESA’s ERS-2 satellite, launched in 1995, and the Advanced Along Track Scanning Radiometer (AATSR) on ESA’s Envisat satellite, launched in 2002.
These twin radiometer sensors work like thermometers in the sky, measuring thermal infrared radiation to take the temperature of Earth's land surfaces. Fires are detected best during local night, when the surrounding land is cooler.
Temperatures exceeding 312º K (38.85 ºC) are classed as burning fires by ATSR/AATSR, which are capable of detecting fires as small as gas flares from industrial sites because of their high temperature.
The WFA is an internal and Data User Programme (DUP) project.