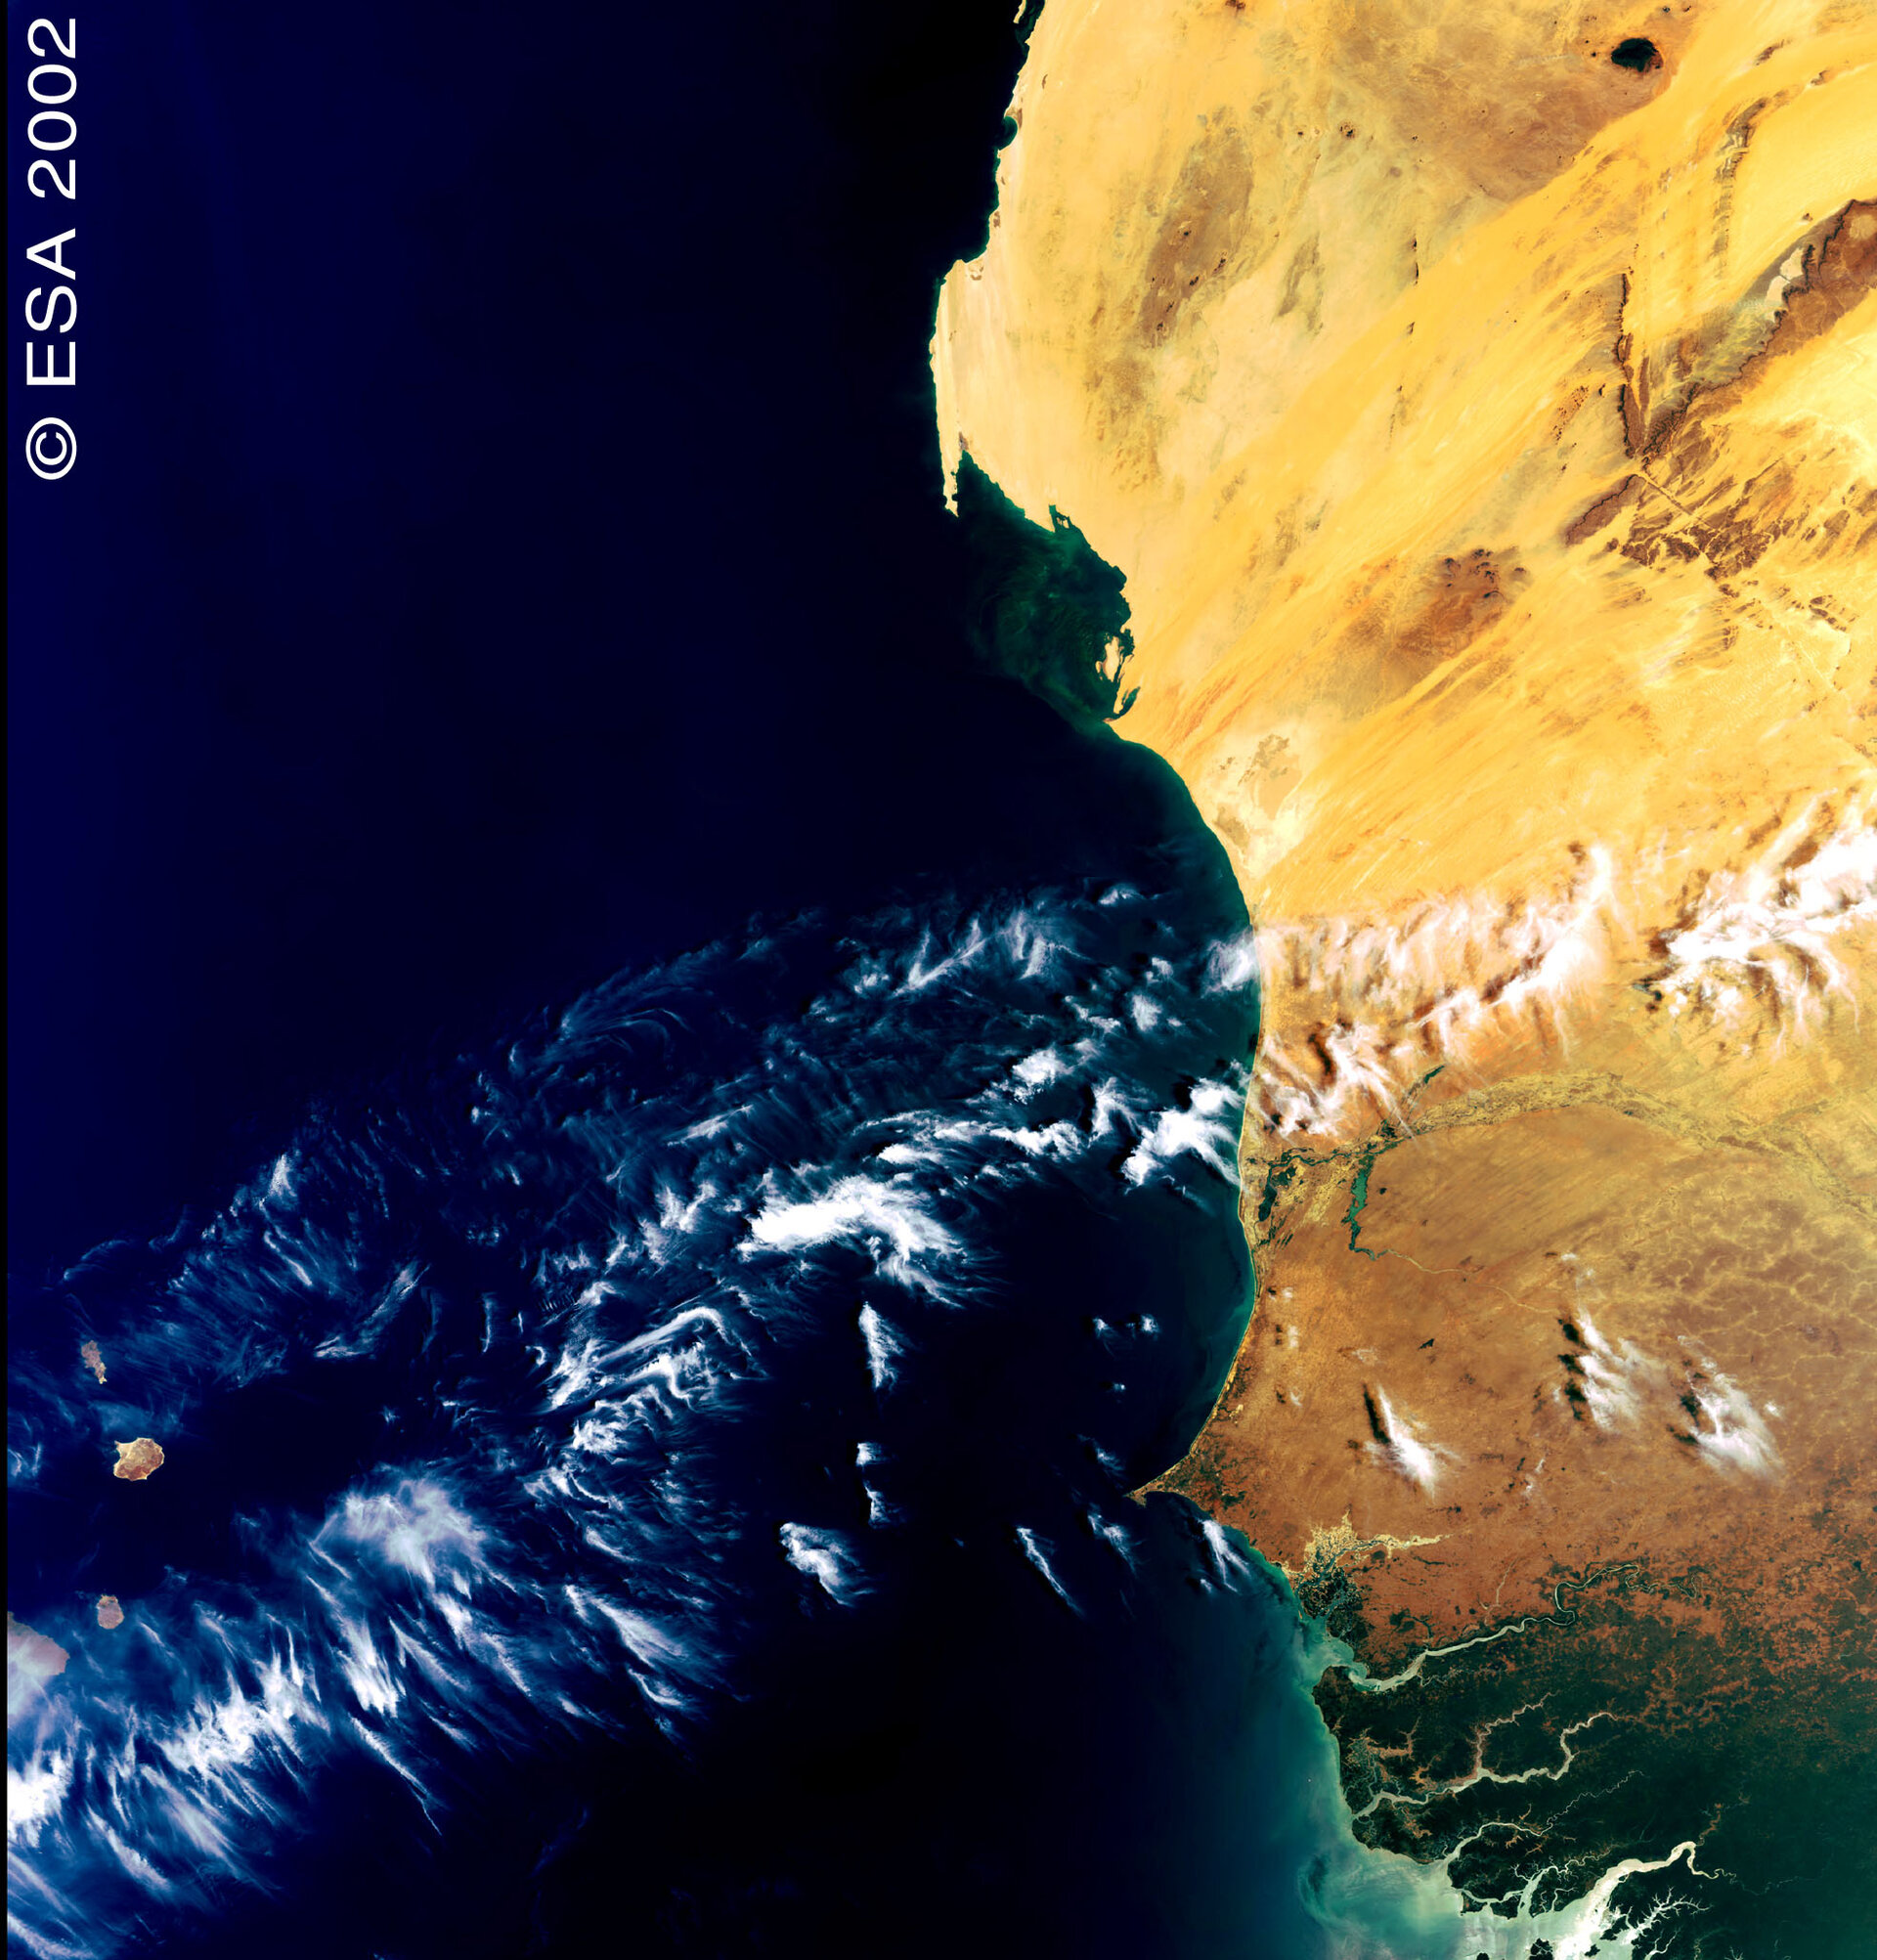
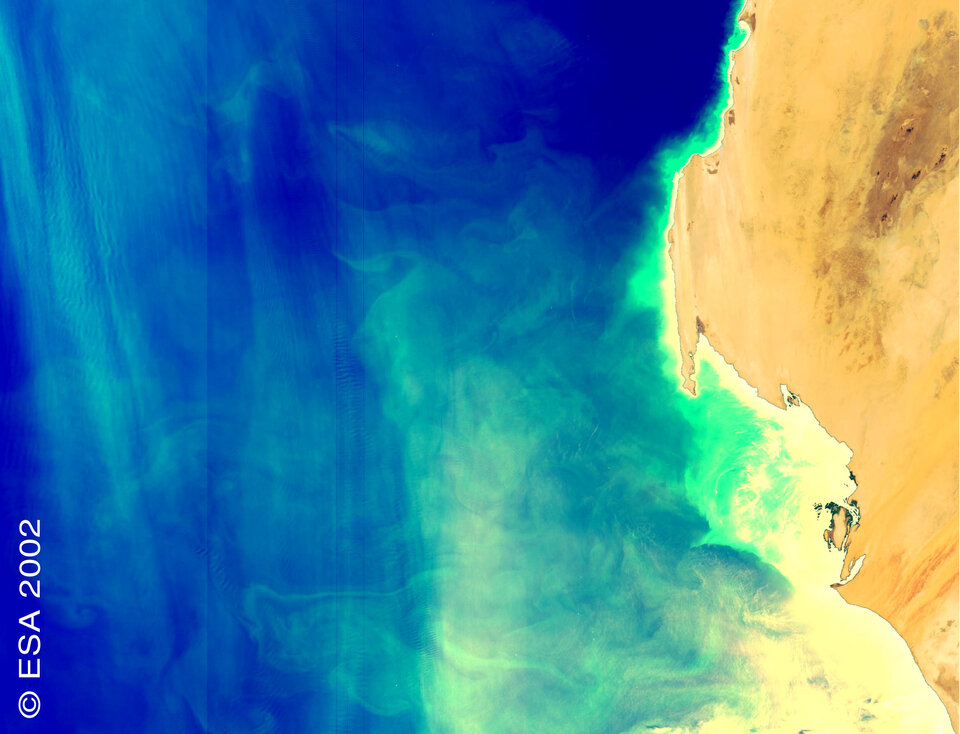
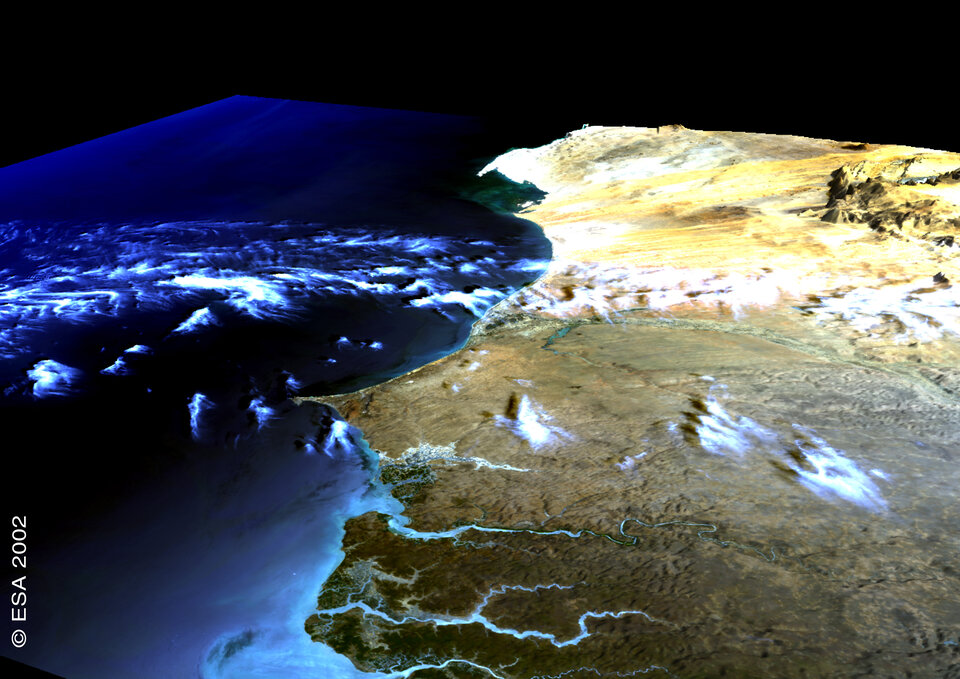
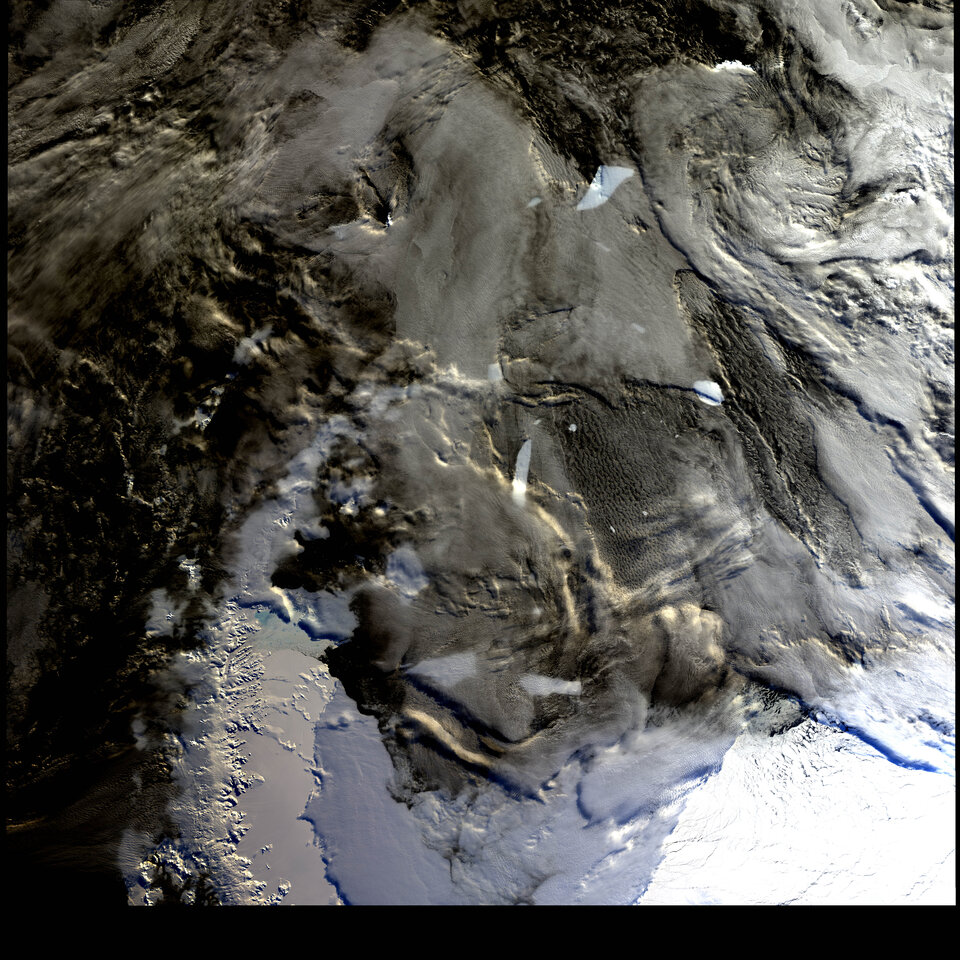
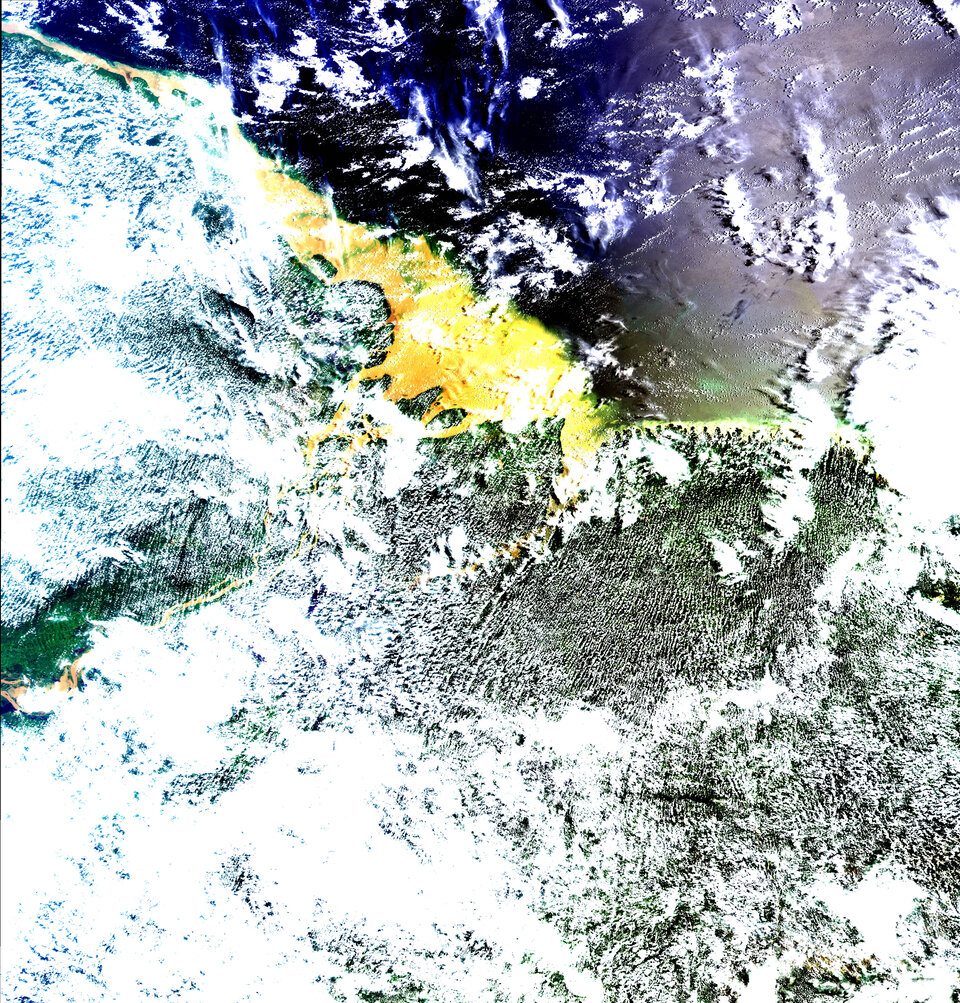
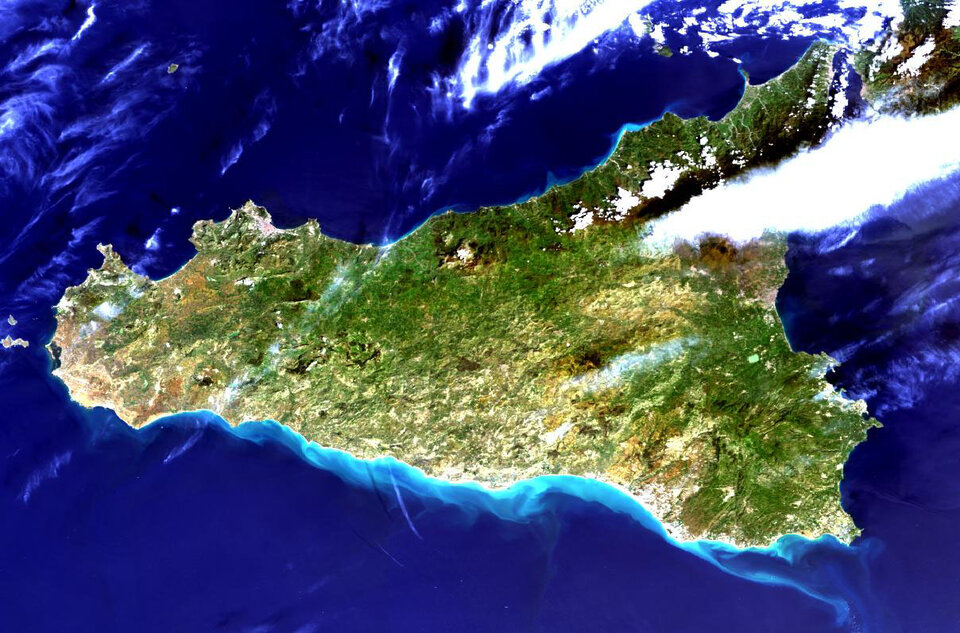
ESAHomeUnderstanding Our PlanetSecuring Our EnvironmentBenefiting Our Economy
   
About Observing the Earth
How does Earth Observation work?How to get Earth Observation dataIntegrating Earth Observation in your jobEarth Observation users speak
EO programmes
The Living PlanetGMES
ESA's Earth Observing missions
Envisat overviewERS overviewEarth Explorers overviewSentinels overviewMSG overviewMetOp overviewProba-1 overviewThird Party Missions overview
Opportunities with us
Multimedia
Services
CalendarSubscribe Bookmark and Share


Article Images
Envisat MERIS first check-up of the Earth - The story in pictures
 
28 March 2002

West Coast of Africa - MERIS, 22 March 2002
Download:
 HI-RES JPEG (Size: 547 kb)
The first MERIS observation captured the huge phytoplankton patch produced by the 'upwelling' mechanism along the west coast of Africa near Mauritania. The unprecedented resolution allows fine-scale structures to be detected. In such upwelling areas, northeast trade winds bring deep and nutrient-rich water to the surface, feeding phytoplankton. Changes in climate affect the intensity of the upwelling with important consequences for marine ecosystems, fisheries and local economies.

One important task for MERIS is to provide overviews of the dynamics of upwelling areas and their primary production. This, in turn, could improve management of fish stocks within sustainable limits. Another important task for MERIS is to provide information on carbon fixation through photosynthesis within the global ocean for a better understanding of the carbon cycle.
Technical Information:

Instrument: MEdium Resolution Imaging Spectrometer (MERIS)
Date of Acquisition: 22 March 2002
Orbit number: 00306
Instrument features: Full resolution image (300-meter resolution).
MERIS was designed to measure the concentration of phytoplankton. The colours seen by MERIS indicate the concentration of chlorophyll, the pigment that phytoplankton use for photosynthesis. MERIS can detect chlorophyll concentrations as low as 0.01 microgram, or 1/100 000 000 of a gram, per litre. MERIS data will be used to monitor the worldwide distribution of phytoplankton and to compute primary production.

Credits: ESA


Mauritanian Upwelling - MERIS - 22 March 2002
Download:
 HI-RES JPEG (Size: 294 kb)
Small, single-celled phytoplankton play a key role in the marine food chain. They convert sunlight, carbon dioxide and nutrients into carbohydrates on which nearly all life in the ocean depends.

In most parts of the Earth's ocean, phytoplankton concentration is extremely low. However, in “upwelling areas,” deep water is pumped up to the surface by strong winds, such as trade winds blowing parallel to the coast. This deep water is rich in nutrients and as this supplies phytoplankton with the nitrogen, phosphate and silicate they need for their growth, which supports the whole food chain.

The most important fishing grounds can be found in these upwelling areas. When this upwelling process collapses, as for instance off the Peruvian coast during El Nino events, the ecosystem is dramatically disrupted. Climate change has an impact on the intensity and geographical position of upwelling areas, which, in turn, has important consequences to fishing industries and those who depend on them.

Technical Information:
Instrument: MEdium Resolution Imaging Spectrometer (MERIS) on board Envisat
Date of Acquisition: 22 March 2002
Orbit number: 306
Instrument features: Full resolution image (300-meter resolution).
MERIS was designed to measure the concentration of phytoplankton. The colours seen by MERIS indicate the concentration of chlorophyll, the pigment that phytoplankton use for photosynthesis. MERIS can detect chlorophyll concentrations as low as 0.01 microgram, or 1/100 000 000 of a gram, per litre. MERIS data will be used to monitor the worldwide distribution of phytoplankton and to compute primary production.

Credits: ESA


The Casamance region of Senegal
Download:
 HI-RES JPEG (Size: 337 kb)
One of the first photos taken by Envisat, ESA's Earth observation satellite on 22 of March 2002. This MERIS image shows the complex river system inside Casamance with its heavy discharge into the sea. A series of such images are needed to monitor the transport of sediment which arises from inland soil erosion. This scence covers the transition zone between savannah in the north and tropical vegetation in the south. MERIS can also monitor the intensification of land use which leads to increased erosion and soil loss.
Technical Information:
Instrument: MEdium Resolution Imaging Spectrometer (MERIS)
Date of Acquisition: 22 March 2002
Orbit number: 00306
Instrument features: Full resolution image (300-meter resolution). MERIS was designed to measure the concentration of phytoplankton. The colours seen by MERIS indicate the concentration of chlorophyll, the pigment that phytoplankton use for photosynthesis. MERIS can detect chlorophyll concentrations of less than 1/10 000 000 of a gram per litre. MERIS data will be used to monitor the worldwide distribution of phytoplankton and to compute primary production.

Credits: ESA
 
 
MERIS scene viewed in perspective
Download:
 HI-RES JPEG (Size: 1140 kb)
MERIS scene viewed in perspective, with African topography derived from ERS-2 altimeter data.

Credits: ESA
 
 
Upwelling area off the coast of Mauritania
Download:
 HI-RES JPEG (Size: 9502 kb)
One of the first photos taken by Envisat, ESA's Earth observation satellite in March 2002.

Just as some areas of land are more fertile than others, the same is also true of the Earth’s oceans, these are known as “upwelling areas”. Using ASAR and MERIS together, Envisat has imaged one such upwelling area off the coast of Mauritania, in northwest Africa. The Envisat ASAR image shown here illustrates how the upwelling formed. Upwellings are driven primarily by winds. On this image, a brighter water surface indicates a stronger wind, while surface line patterns indicate wind direction. In this case, trade winds blowing water to the continent’s edge pump deep water rich in nutrients to the surface, which causes a population explosion in local marine life, starting with the phytoplankton.

Credits: ESA


Antarctic Peninsula - MERIS, 24 March 2002
Download:
 HI-RES JPEG (Size: 2758 kb)
The Antarctic Peninsula, visible on the left side of this image, extends for 1000 km in a south-north direction and is situated between the Bellingshausen Sea on the west and the Weddell Sea on the east.

This region has experienced exceptional atmospheric warming since the 1950s and is therefore of key interest for global change research. Over the last 50 years an average temperature increase of 2.5°C has been observed at the climate stations on the Peninsula. This has triggered the retreat and break-up of several ice shelves, culminating in the collapse of the two northern parts of the Larsen Ice Shelf in January 1995 (Larsen A) and in March 2002 (Larsen B). Some of the icebergs results of this collapse can be distinguished under the cloud layer.

Technical Information:
Instrument: Medium Resolution Imaging Spectrometer (MERIS)
Date of Acquisition: 24 March 2002
Orbit number: 335
Instrument features: Full resolution image (300-meter resolution)

Credits: ESA


Fluorescence of phytoplankton
Download:
 HI RES JPG (Size: 394 kb)
One of the first photos taken by Envisat, ESA's Earth observation satellite on 22 March 2002. MERIS has the capability to remote sense phytoplankton by observing their fluorescence. Phytoplankton pigments absorb light in short-wavelength radiation (blue) and partially reemit it at the fluorescence wavelength. This technique is of very high interest in coastal waters where turbidity makes chlorophyll retrieval more difficult than in the open ocean. This image is the very first attempt done to verify the capability of MERIS to detect fluorescence from space. It will take several months of intense field measurements to compare the satellite data to in situ measurements, to perfectly characterize the instrument and make sure high quality data are delivered to MERIS users. The first results are already fascinating and surprisingly rapid.

Credits: ESA
 
 
Mouth of the Amazon – MERIS –  25 March 2002
Download:
 HI RES JPG (Size: 6278 kb)
One of the first photos taken by Envisat, ESA's Earth observation satellite, in March 2002. Flowing more than 6400 km across Brazil, the Amazon River originates in the Peruvian Andes. It is second in length only to the Nile among the rivers of the world. The Amazon discharge shows the huge amount of sediment it has taken away from the lands it has crossed. It deposits a daily average of 3 million tons of sediment near its mouth. The outpouring of water and sediment is so vast that the salt content and colour of the Atlantic Ocean are altered for a distance of several hundred kilometres from the mouth of the river.

Credits: ESA
 
 
Sicily, Italy - MERIS - 21 March 2002
Download:
 HI-RES JPEG (Size: 252 kb)
This is an enlargement of the MERIS image of Italy. The Etna volcano, not active at this time, is partially masked by clouds in the northern part of Sicily.

The green colour of the water along the southern coast of Sicily is due to the coastal erosion by currents in the straights of Sicily. Suspended matter taken away from the beaches is visible in the long plume extending along the southeast extremity of the island.
Technical Information:

Instrument: MEdium Resolution Imaging Instrument (MERIS)
Date of Acquisition: 21 March 2002
Orbit number: 00305
Instrument features: Full resolution image (300-meter resolution)

Credits: ESA


   Copyright 2000 - 2010 © European Space Agency. All rights reserved.