Four years on, Envisat hailed for its contribution to Earth science
Since its launch in 2002, Envisat, the world’s largest and most sophisticated satellite ever built, has been providing scientists and operational users with invaluable data for global monitoring and forecasting – and the future looks even brighter.
"The Envisat mission has reached its full maturity with the services provided by the satellite now well established, and the scientific results based on its data being increasingly published," Envisat Mission Manager Henri Laur said.
Envisat, short for environmental satellite, has a unique combination of 10 different instruments which collect data about the Earth’s atmosphere, land, sea and ice – providing scientists with the most detailed picture yet of the state of the planet.
Climate change

The Earth’s climate is undergoing change more rapidly than at any other point since the end of the last ice age, 10 000 years ago. Many scientists and policy makers agree climate change is the biggest problem facing the planet today.
In order for scientists to understand phenomena linked to climate change, it is vital to determine how the Earth’s processes influence each other. Envisat is particularly well suited to make this possible because its instruments collect data simultaneously from the Earth’s systems.
Having access to near-continuous data over long periods of time is important for scientists to identify and analyse long-term climatic trends and changes. Envisat affords this to scientists by providing continuity of data initiated in the early 1990s with previous ESA satellites ERS-1 and ERS-2.
Sea surface temperature is one of the most stable of several geographical variables which, when determined globally, characterises the state of the Earth’s climate system.
"The global sea temperature has been changing over the years. In fact, it has been changing ever since records began but there is now evidence there is a distinctive upward trend in global sea temperature, and this we can now see from measurements made from Envisat," Professor David Llewellyn-Jones of the University of Leicester said.
Rising sea levels are also important in the study of global warming. Radar altimeter (RA-2), one of Envisat’s instruments and an enhanced version of an ERS satellite instrument, makes accurate measurements of the satellite's height above the sea surface which is then converted to the sea surface's height. Data acquired by ERS and Envisat show sea levels have been rising by three millimetres a year since the early 1990s.
Ice monitoring
The recent discovery by Eric Rignot and Pannir Kanagaratnam – using Synthetic Aperture Radar (SAR) data – that the Greenland glaciers are melting at a pace twice as fast as previously thought is consistent with climate change.
Long-term satellite monitoring over Greenland and Antarctica is important because it provides authoritative evidence of trends and allows scientists to make predictions.
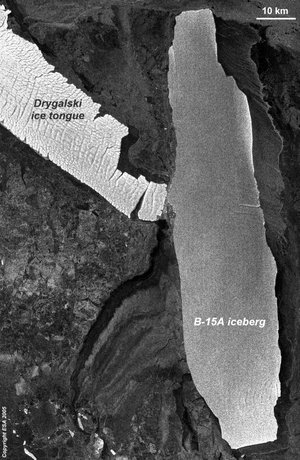
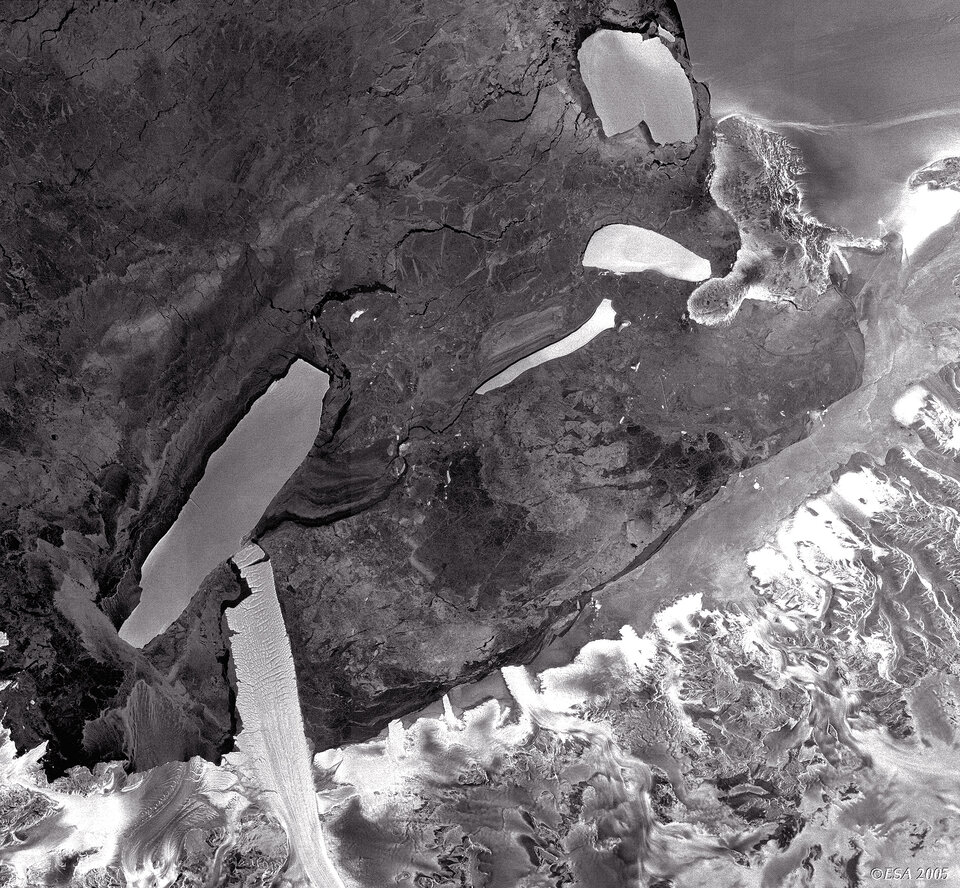
Envisat’s largest instrument, the Advanced Synthetic Aperture Radar (ASAR), is able to produce high-quality images of these ice sheets because it is able to see through clouds and darkness – conditions often found in polar areas.
Within days of its launch, Envisat captured the disintegration of the Larsen-B ice shelf in Antarctica. The images surprised scientists because of the rapid rate at which the shelf broke apart.
"The experience with Larsen shows the glaciers … are more vulnerable than we thought before," Innsbruck University’s Professor Helmut Rott said.
Atmospheric monitoring
Envisat circles the globe 14 times a day at a speed of seven kilometres per second providing continuously updated measurements of the swift changes occurring in the atmosphere.
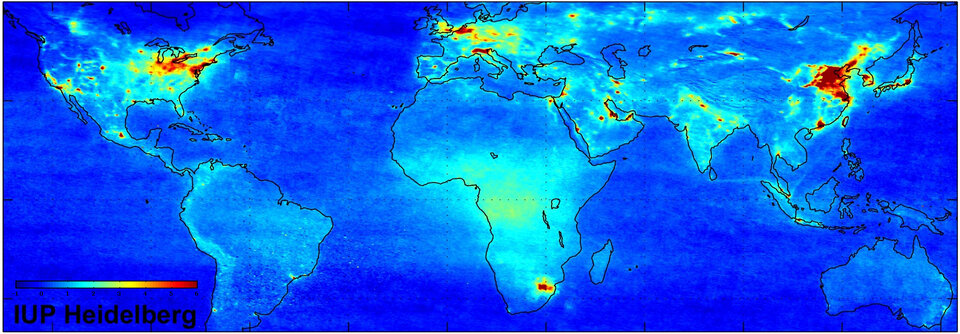
The Scanning Imaging Absorption Spectrometer for Atmospheric Chartography (SCIAMACHY) instrument measures atmospheric trace gases by observing reflected and scattered sunlight. It has allowed scientists to develop global mapping by routinely supplying data for global ozone thickness as well as pollution.
"In 2003, we had 7 000 deaths in Europe from air pollution as a result of fires. The ability to develop predictive capability, which was in the past just not feasible, is a new area which will hopefully enable such disasters to be minimized," Professor John Burrows of the University of Bremen said.
Earthquake monitoring

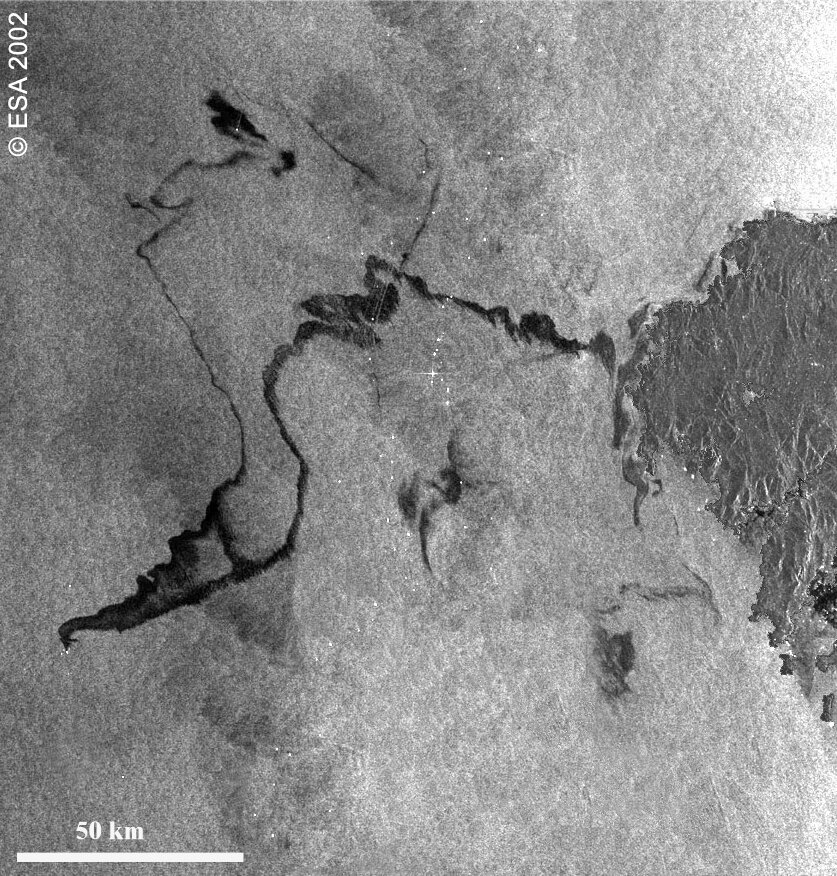
Shifts in the movement of the earth’s crust are a fearful hazard in many parts of the world. As part of its ‘background mission’, Envisat acquired images of the most seismically active areas of the Earth’s land surface (roughly 15 percent of land).
This data proved invaluable in assessing the earthquake in Bam, Iran, in December 2003, which resulted in the deaths of 26 000 people.
Envisat’s capability through ASAR’s radar interferometry – a technique which compares two radar images, usually recorded from satellite, taken at slightly different locations to obtain surface change – gave scientists a unique insight into the cause of this tragedy by revealing a blind fault.
According to Oxford University Professor Barry Parson, studying radar images of the ground around Bam before and after the quake allowed scientists to construct an interferogram and tell geologists in Iran that the fault was actually in a different place than previously thought.
Coastal monitoring
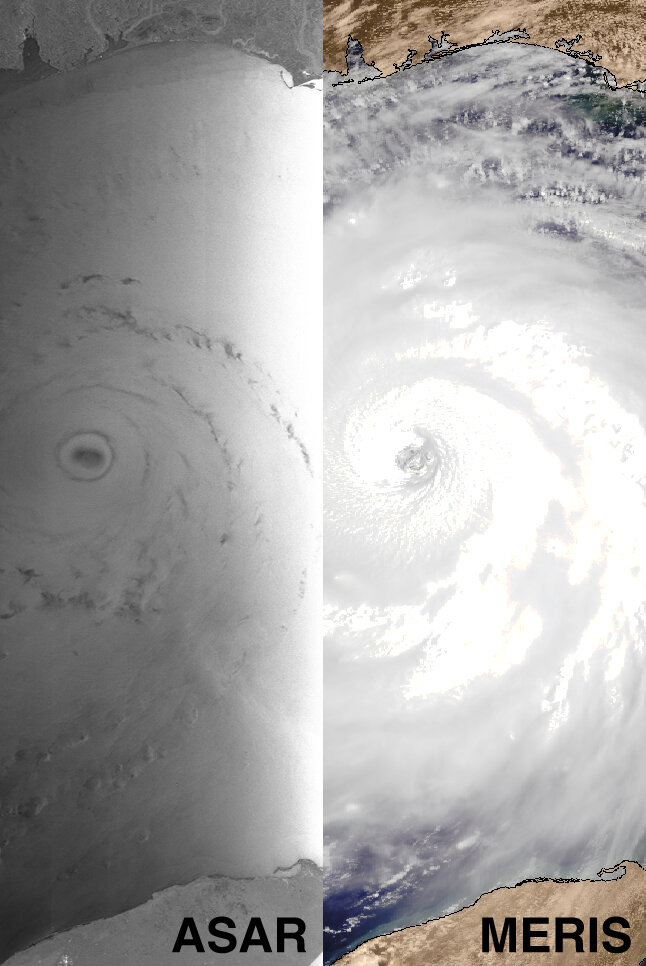
Envisat is the only satellite with the capability to provide synergy between radar and optical data, due to the power and depth of its instrumentation.
This ability – made possible by Medium Resolution Imaging Spectrometer (MERIS) and ASAR – provides scientists with unique views of coastal phenomena.
While an optical image observes high-atmosphere cloud structure, a simultaneous radar observation pierces through the clouds to measure the sea surface. For instance, when Hurricane Katrina formed in August 2005, Envisat captured the storm from cloud tops to ocean waves.
Dr. Johnny Johannessen, of the Nansen Environmental and Remote Sensing Centre in Norway, said displaying the MERIS image next to the ASAR image gave scientists a more complete understanding of Hurricanes Katrina and Rita.
"You [could] clearly see the eye of the hurricane. You [could] also see the trajectory of these hurricanes and where they [would] eventually hit the coastal areas," he said.
Providing almost real-time data
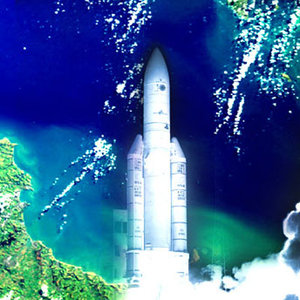
By relaying information through its sister satellite Artemis, Envisat is able to supply data in almost real time. Faster, more accurate data has resulted in almost 1 000 scientific projects currently using Envisat, and the number is rising at a rate of 20 or 30 a month.
Envisat data are also increasingly used for operational applications like monitoring the sea ice, oil slicks and illegal fisheries, among others. These applications require the fastest possible access to the satellite data so that quick decisions can be made.
The need for near real time information is also fundamental for the continuing development of prediction models, such as forecasts for sea waves, UV and vegetation stress.
About 250 gigabytes of data products are generated every day by the Envisat mission – not only for immediate use, but also for building an archive for the next generation to use.
Future of Envisat

Envisat was initially intended to stay in orbit for five years. However, given the overall excellent standing of the satellite, the ESA Ministerial Council agreed last December in Berlin, Germany, to fund the Envisat mission until 2010.
"This is a very important decision that was driven by requests from the Earth Science community and the need to fulfil the needs of the GMES programme in its early phase.
"In addition to using the funding for satellite operations, it will also be used,to further improve the services offered to our users, such as providing even easier access to the data, further improving the quality of the processors used to interpret the data and supporting the data re-analysis," Laur said.
"I think we are just seeing the beginning of what Envisat in total will give us in 2010," Dr. Johannessen said.