

Envisat monitoring China floods as part of Dragon Programme
China's rainy season has led to serious flooding in the north-east and south of the country. A joint Chinese-European team is gathering Envisat radar imagery of the developing situation to give the authorities a way to swiftly assess affected areas and plan their responses.
Summer flooding is nothing new in these regions of the People's Republic of China (PRC), though this year it is proving particularly severe, with more than 800 casualties countrywide and 2.45 million people forced to evacuate their homes. However this season's flooding is being monitored in near real-time by ESA's Envisat Advanced Synthetic Aperture Radar (ASAR) sensor, which can acquire imagery in both day and night and in all weathers.
This activity is taking place as part of ESA's Dragon Programme of cooperation with the National Remote Sensing Centre of China (NRSCC) within the Ministry of Science and Technology of the PRC. These Envisat images are a means for the authorities to identify floodwater extent and coordinate mitigation efforts, and should be a foretaste of things to come – next season the aim is that a full near real-time monitoring service should be operational.
Flood Rapid Mapping is a dedicated Dragon thematic area. A short notice acquisition and delivery procedure exists within it, enabling Chinese partners to request ASAR acquisitions ahead of the satellite overpass. The processed images are available to download from ESA servers within eight hours after acquisition.
Strasbourg-based company SERTIT, specialising in rapid satellite mapping, has been cooperating with a team of Chinese researchers led by Professor Li Jiren of the China Institute of Water Resources and Hydropower Research (IWHR) of the Ministry of Water Resources in Beijing.

"We have been working to evaluate this procedure with our Chinese partners," explained Hervé Yésou of SERTIT. "We carried out our first testing in February, then in early June we carried out a rush acquisition of Poyang Lake flooding the town of Nanchang in Jiangxi Province and the flooding of Donting Lake in Hunan Province. Envisat ASAR images acquired on 5 June were processed and disseminated on 6 June. The flood maps and images were sent to our Chinese colleagues at the IWHR as well as the National Disaster Reduction Centre of China (NDRCC) at the Ministry of Civil Affairs and other partners of the Flood Dragon project.
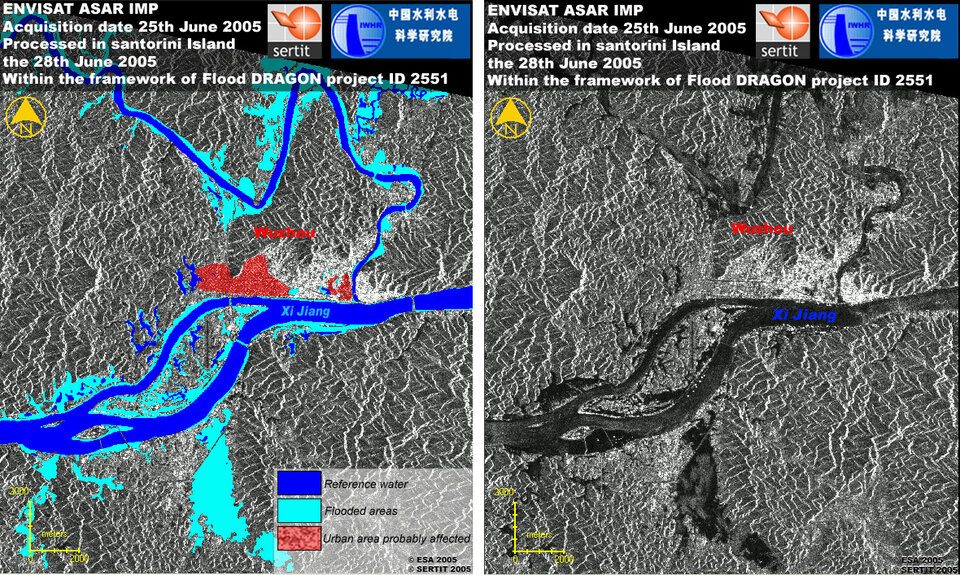
"Then at the end of June came a major flood of the Xijiang River that affected the town of Wuzhou in Guangxi Province. At that time both the Chinese and European teams were away at the Dragon Programme symposium in Santorini, Greece. In the event we still managed to access, process this crisis data, then present it to the symposium.

"Most recently, in mid-July, we have seen flooding of the Nenjiang River in Heilongjiang Province in northeast China, following continuous rainfall reported in the vicinity of the city of Qigihar."
Flood monitoring is only one of numerous Dragon Programme research themes, which range from agriculture and forests to seismic activity and landslide monitoring, assessing drought, air quality, oceanography and climate. Dragon formally began in April 2004. Since then more than 2500 radar images from Envisat and ESA's ERS missions have so far been delivered to Dragon teams.

The latest Dragon Symposium took place in Santorini between 27 June and 1 July, attended by 120 scientists including 50 from PRC.
Progress and early results were reported during the event and updates were given on project teaming, including Greek scientists joining as co-investigators. Supporting in-situ data measurements required to validate satellite results were detailed and reports were made from an associated young scientist training programme.
Presentations included details of research being done into the synergistic use of ASAR with Envisat's optical Medium Resolution Imaging Spectrometer (MERIS) and other satellite sensors for the building up of land use databases for flood disaster assessment. Also recounted was how using ASAR in multipolarisation mode improves the definition and mapping of flood extents, and the measuring of soil moisture content in the upper surface layer.
Dragon at sea

Water away from the land proved another promising thematic area, with oceanographers taking a particular interest in the China Seas.
Presentations covered how ocean colour measurements made by Envisat's MERIS can reveal marine phytoplankton populations – important as the base of the marine food web and a key sink of carbon – as well as suspended sediment.

Researchers are building up a database of water optical properties as well as atmospheric correction for the region and developing a method of monitoring 'red tide' events – when local conditions cause phytoplankton numbers to explode out of control. MERIS is also being used to look at the estuary of the Yangtze River, whose waters have some of the highest sediment content in the world.
Parameters of waves on the surface of the East China Sea are being studied with ASAR data, while teams are using Envisat's heat-sensitive Advanced Along Track Scanning Radiometer (AATSR) in conjunction with ASAR and MERIS to study the Kuroshio Current, which is the Chinese equivalent of Europe's Gulf Stream, flowing from the Philippines to northern Japan.
Dragon in the air
The air over China is also an area of interest to Dragon researchers, with satellites proving an especially useful tool for analysing trends and seasonal variations in atmospheric pollution.
Envisat's Scanning Imaging Absorption Spectrometer for Atmospheric Chartography (SCIAMACHY) can identify multiple trace gases including the pollutant nitrogen dioxide created artificially by vehicle exhausts, fossil fuel burning and heavy industry.

SCIAMACHY results tally with previous results gathered by the Global Monitoring Ozone Experiment (GOME) aboard ERS-2 since 1995, showing a steady increase in nitrogen dioxide levels in industrialised eastern China.
"For trend analyses it is important to have long time series of measurements in order to calculate a trend with enough significance," explained Dr. Ronald van der A of the Royal Dutch Meteorological Institute (KMNI). "By combining the GOME and SCIAMACHY observations we obtained a data set of nearly ten years, which was enough for our trend study. Although we had expected a positive trend in NO2 in China due to its booming economy, the magnitude of the trend, up to 25% per year for the Shanghai region was surprising."
In the west of the country the results show there are no artificial pollution sources, so that natural sources such as lightning and soil emissions are more significant.


