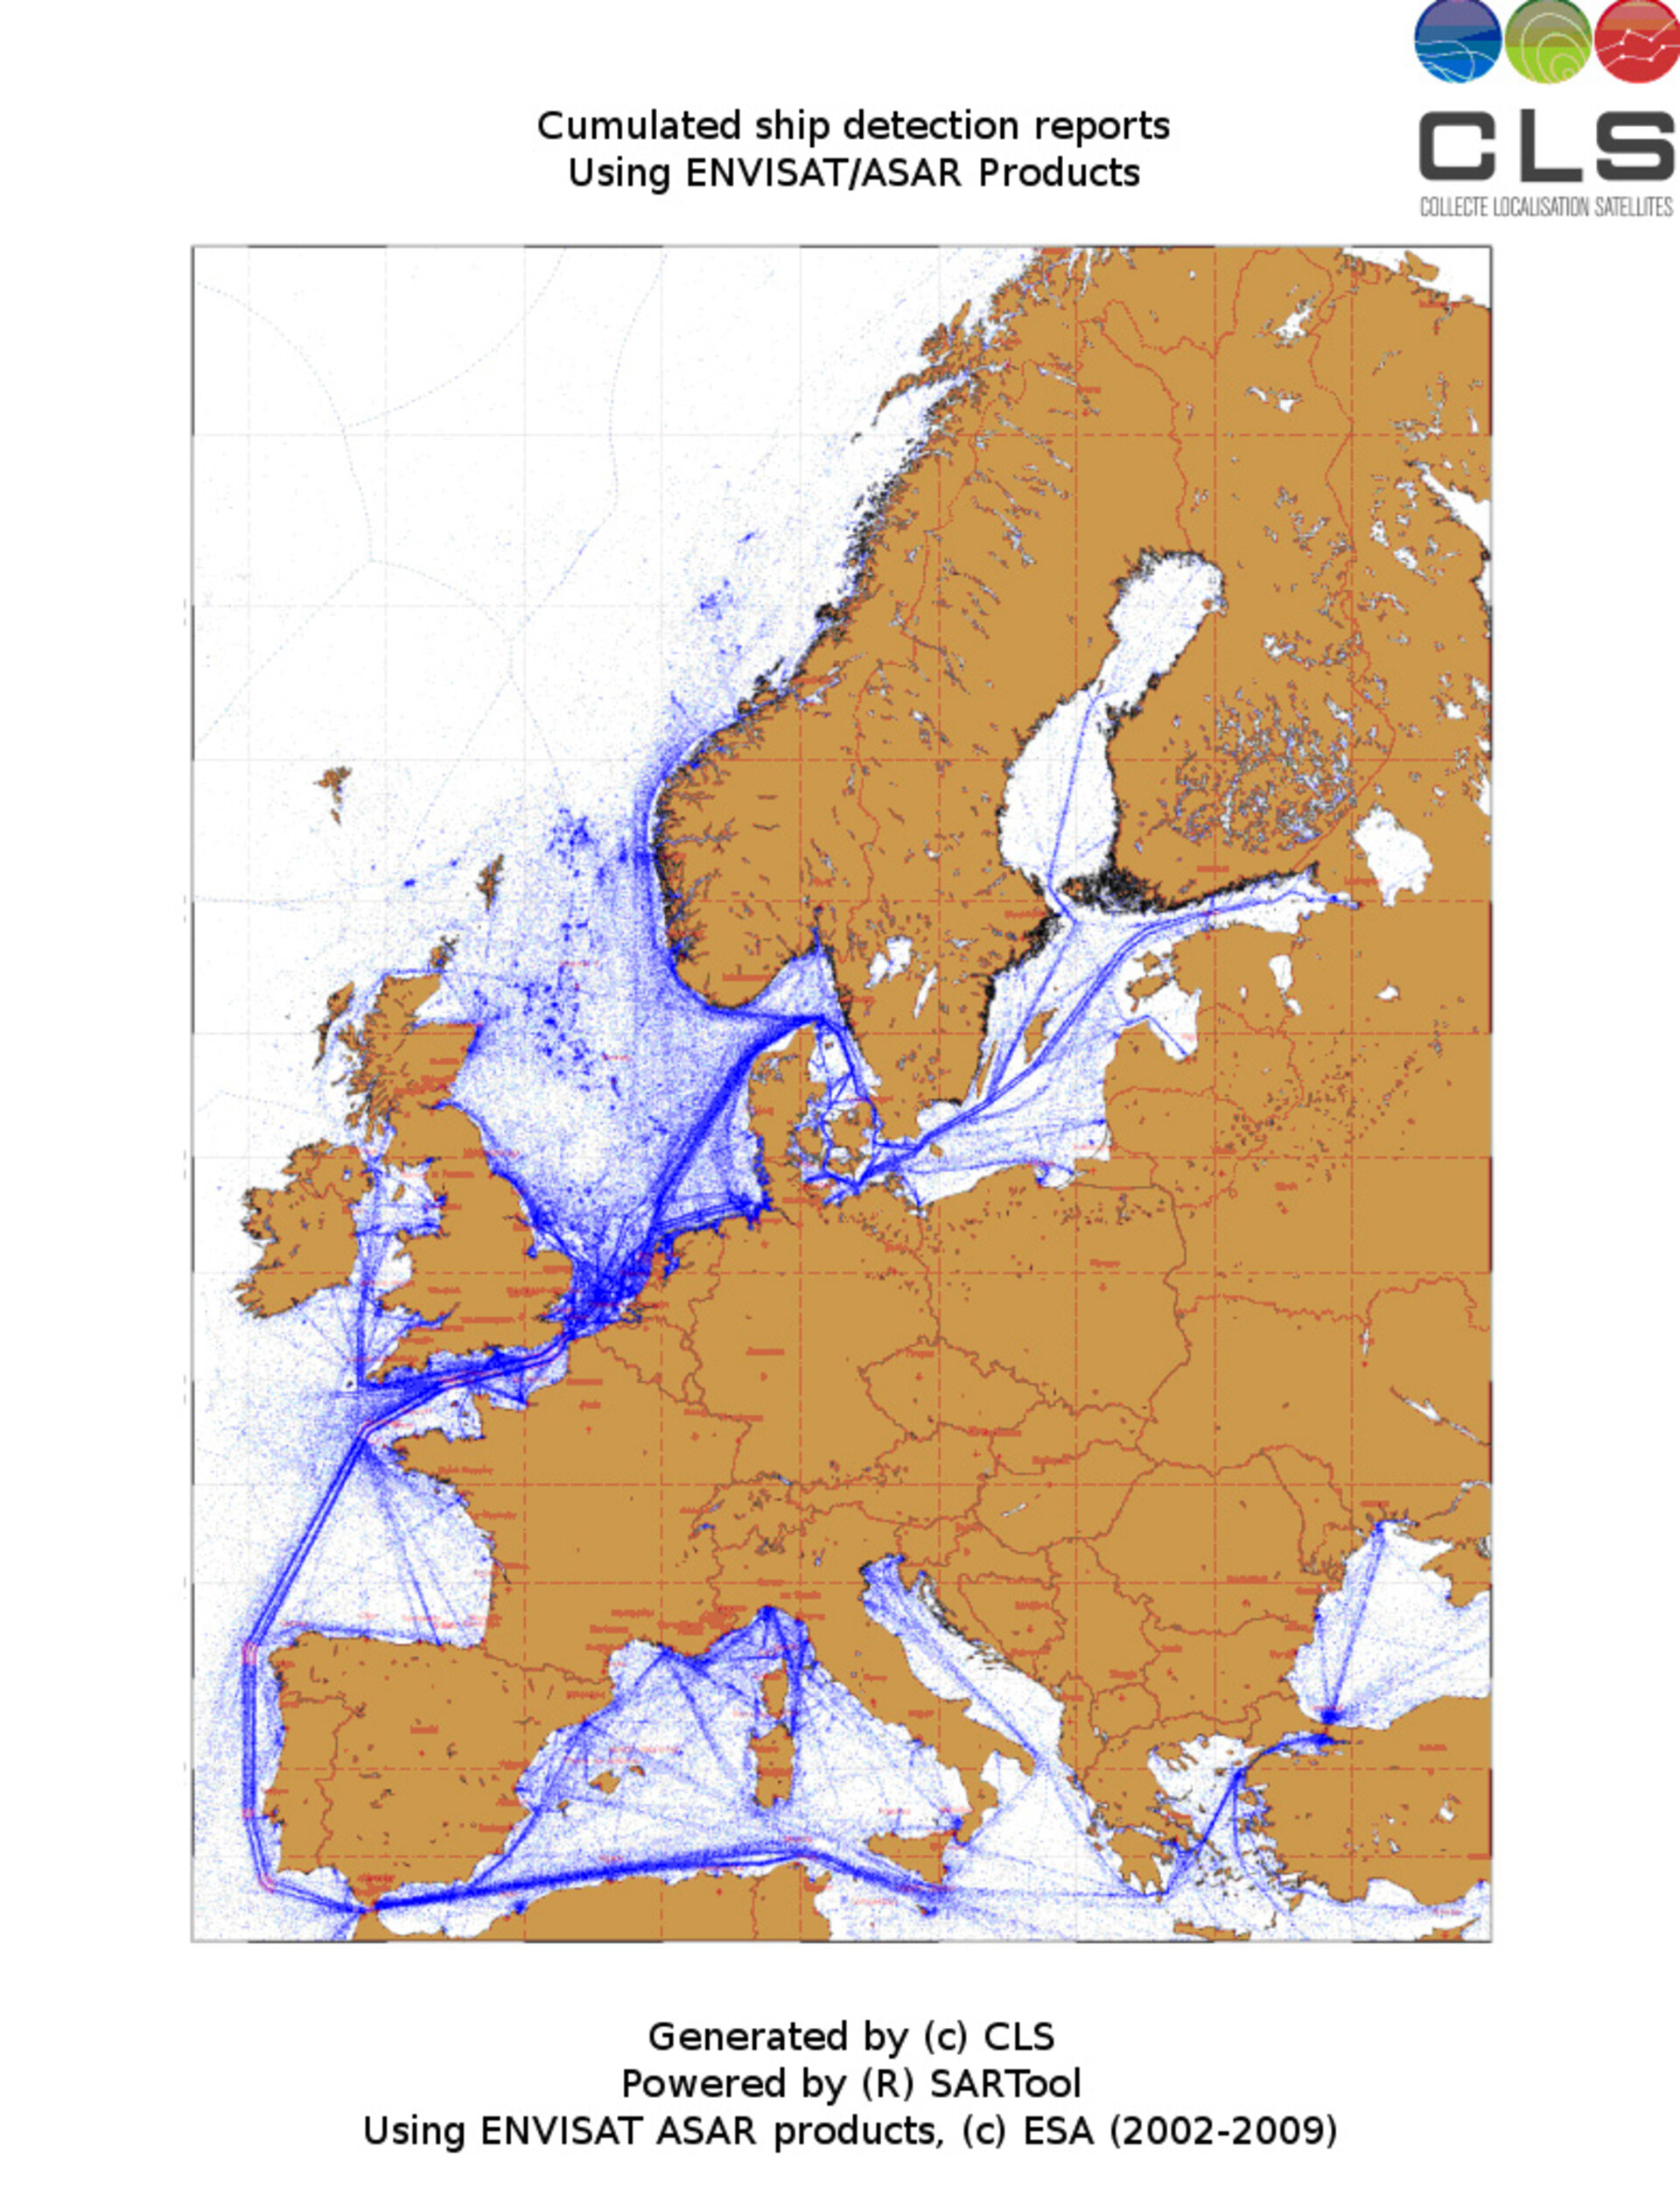
ESA map reveals European shipping routes like never before
A synoptic view of European shipping routes can be seen for the first time thanks to a new map created using seven years of radar data from ESA’s Envisat satellite.
Earth observation satellites have been providing ship-detecting services for several years, but this is the first time this amount of data collected over an extended period has been processed to produce an overview of ship traffic patterns.
Dr Vincent Kerbaol and Guillaume Hajduch of France’s CLS (a subsidiary of the French space agency, CNES) created the map based on a new ship detection algorithm they developed. Using this algorithm, they processed near-real time products from Envisat’s Advanced Synthetic Aperture Radar (ASAR) from 2002 to 2009.
Hajduch calibrated the products they retrieved from the ESA archive and then, because ships appear as bright points in radar images, identified the bright pixels located in marine areas.
Despite the fact that ships are more energy efficient than other forms of commercial transportation, many marine engines operate on extremely dirty fuel that causes large emissions of air pollutants like sulphur dioxide (SO2) and nitrogen dioxide (NO2).
SO2 and NO2 emissions from ships are responsible for acid rain, which is harmful to the environment, and particulate matter, which is harmful to humans. As well as detecting emissions from industry and other commercial means of transportation, NO2 emissions from ships can be measured from space along major shipping routes. To illustrate this, a NO2 map has been placed on top of the shipping route map in the above animation. The routes clearly correspond to the pattern of detected NO2.
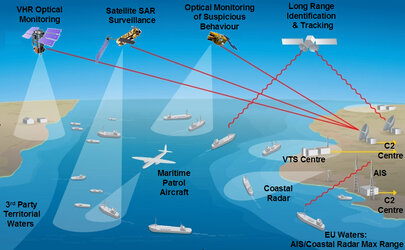
Sea surface monitoring of ships is very important for observing marine transportation and can help marine authorities ensure admiralty routes are being observed.
For instance, the Maritime Safety Committee amended the traffic separation schemes off the coast of Portugal in 2005 to include the addition of two shipping lanes and to move the lanes farther away from the coast. These ASAR images on the right, acquired before and after the new schemes were enforced, show that they were implemented.

In addition to highlighting shipping routes, satellite views also detect harbours that are populated with vessels, as illustrated in the ASAR image of the North Sea to the left.
The ports of Calais in France, Antwerp in Belgium, Bremen and Hamburg in Germany and Europoort in the Netherlands, one of the busiest harbours on the planet, are all heavily populated with vessels in this image (denoted by dense, blue dots).