Venus comes to life at wavelengths invisible to human eyes
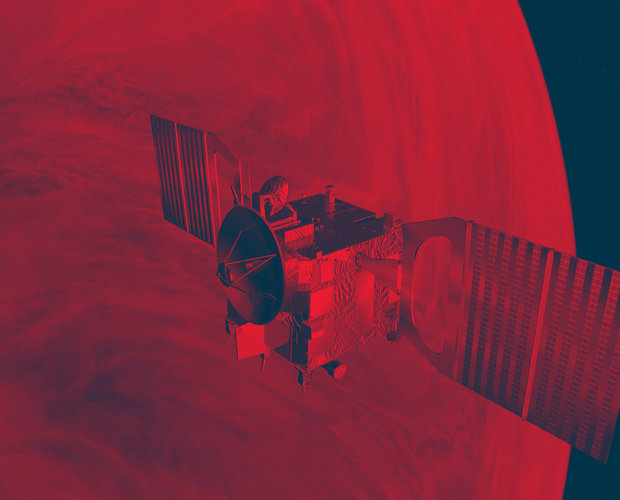
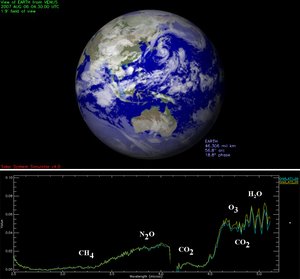
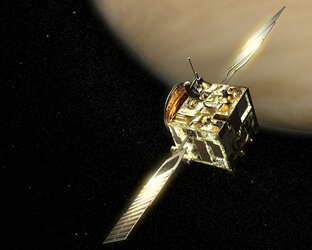
A pale yellow dot to the human eye, Earth’s twin planet comes to life in the ultraviolet and the infrared. New images taken by instruments on board ESA’s Venus Express provide insight into the turbulent atmosphere of our neighbouring planet.
Using Venus Express, it is possible to compare what the planet looks like in different wavelengths, giving scientists a powerful tool to study the physical conditions and dynamics of the planet’s atmosphere.

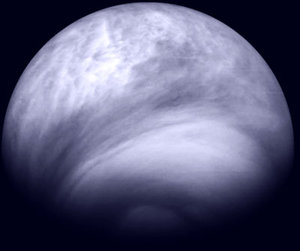
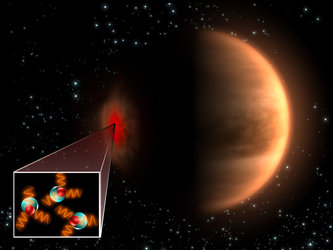
Observed in the ultraviolet, Venus shows numerous high-contrast features. The cause is the inhomogeneous distribution of a mysterious chemical in the atmosphere that absorbs ultraviolet light, creating the bright and dark zones.
The ultraviolet reveals the structure of the clouds and the dynamical conditions in the atmosphere, whereas the infrared provides information on the temperature and altitude of the cloud tops.
With data from Venus Express, scientists have learnt that the equatorial areas on Venus that appear dark in ultraviolet light are regions of relatively high temperature, where intense convection brings up dark material from below. In contrast, the bright regions at mid-latitudes are areas where the temperature in the atmosphere decreases with depth.
The temperature reaches a minimum at the cloud tops suppressing vertical mixing. This annulus of cold air, nicknamed the ‘cold collar’, appears as a bright band in the ultraviolet images.
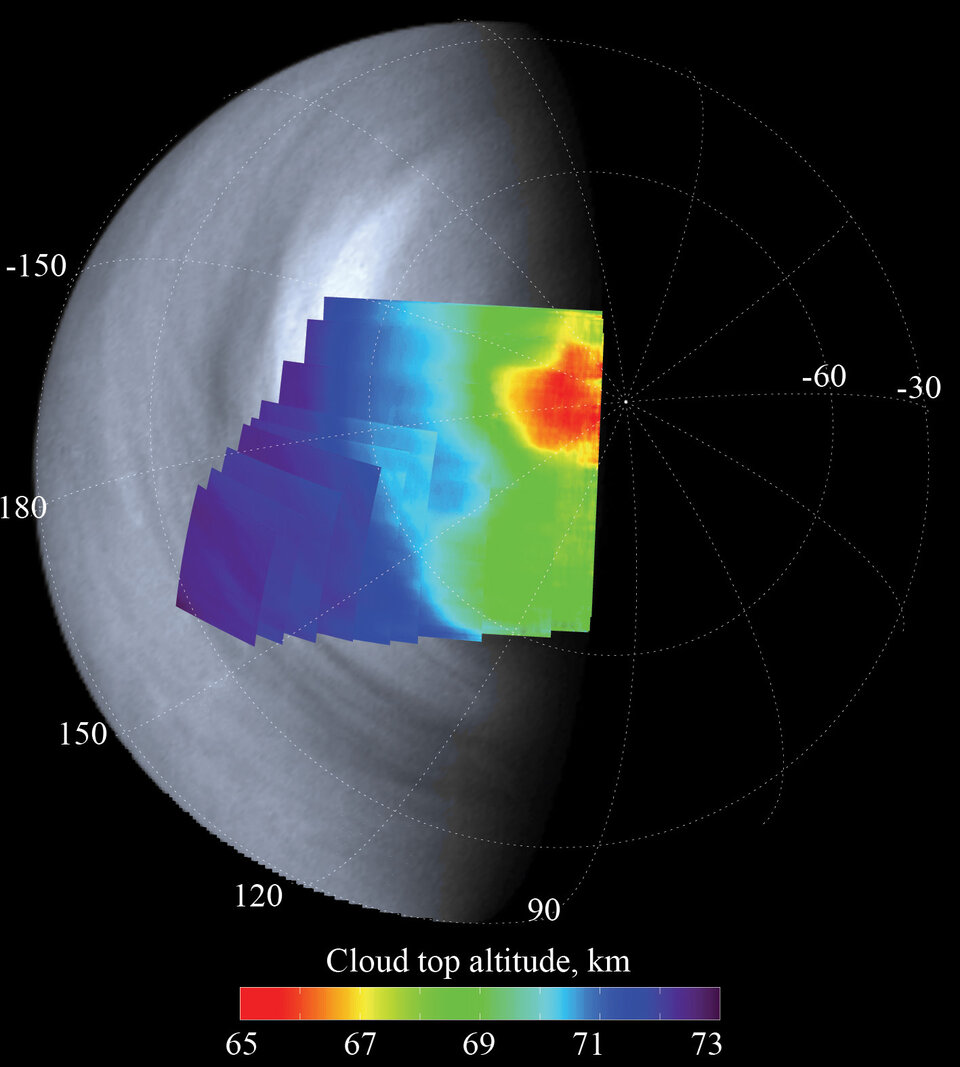
Observations in the infrared have been used to map the altitude of the cloud tops. Surprisingly, the clouds in both the dark tropics and the bright mid-latitudes are located at about the same height of about 72 km.
At 60° south, the cloud tops start to sink, reaching a minimum of about 64 km, and form a huge hurricane at the pole.

In this mosaic, the infrared image is overlaid on an ultraviolet image, bringing the giant hurricane’s eye at the planet’s south pole to life. Its centre is displaced from the pole and the whole structure measures about 2000 km across, rotating around the pole in about 2.5 days.
This study, carried out by D. Titov and colleagues has revealed that variable temperature and dynamical conditions at the Venus cloud tops are the cause of the global ultraviolet pattern.

But the exact chemical species that creates the high-contrast zones still remains elusive, and the search is on.
Notes for editors:
These results appear in ‘Atmospheric structure and dynamics as the cause of ultraviolet markings in the clouds of Venus’ by D. Titov et al., published in the 4 December 2008 issue of the journal Nature.
For more information:
Dmitri Titov, Max Planck Institute for Solar System Research
Germany
Email: Titov @ mps.mpg.de
Håkan Svedhem, ESA Venus Express Project Scientist
Email: Hakan.Svedhem @ esa.int