
ERS at a glance
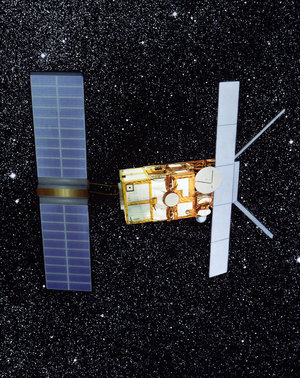
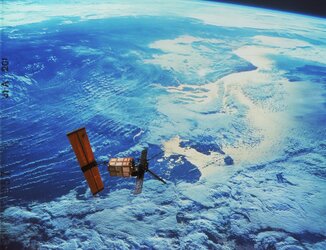
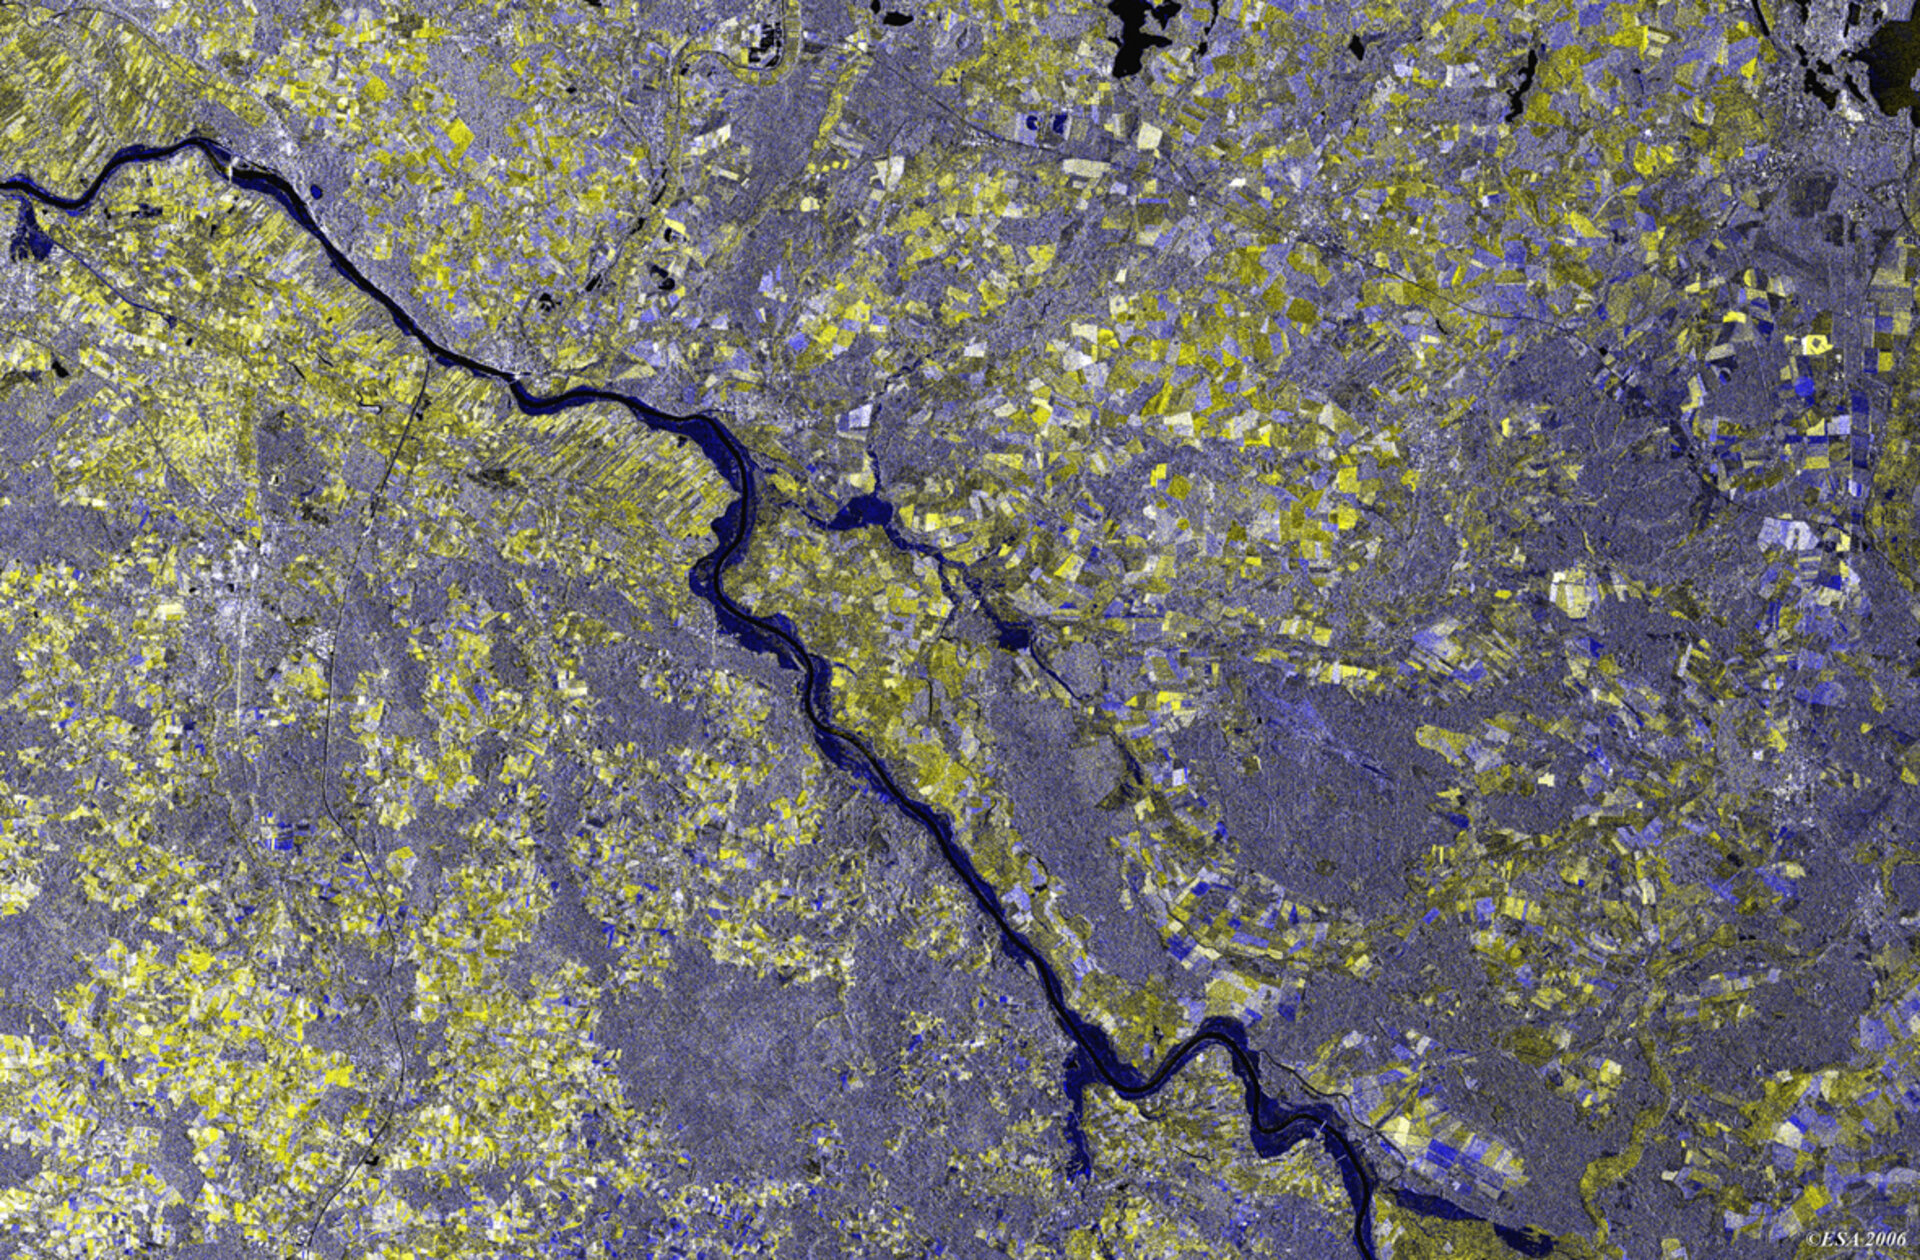
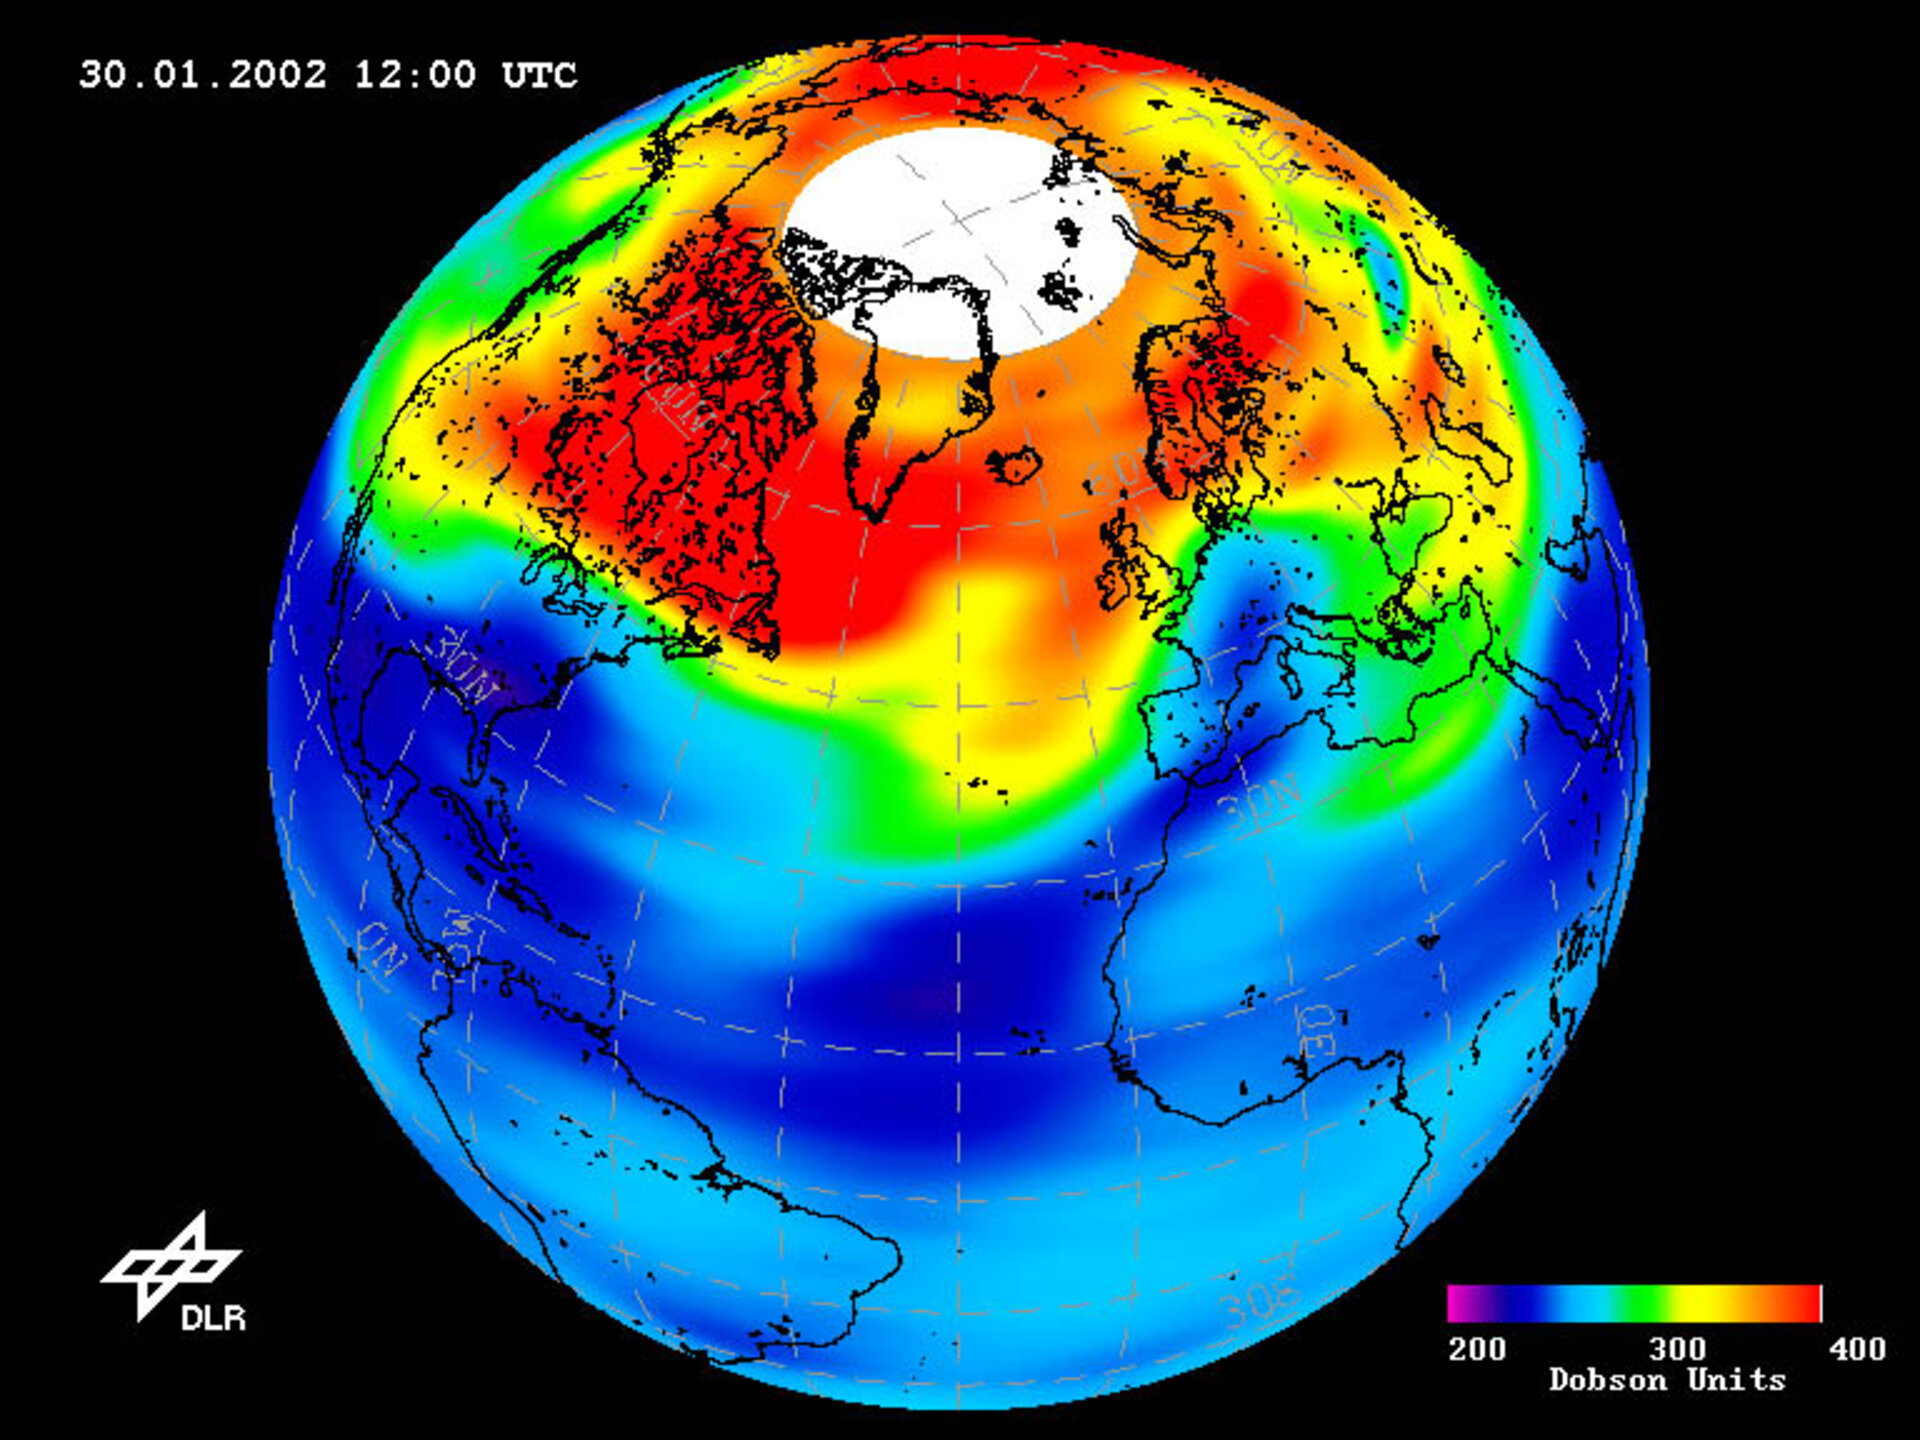
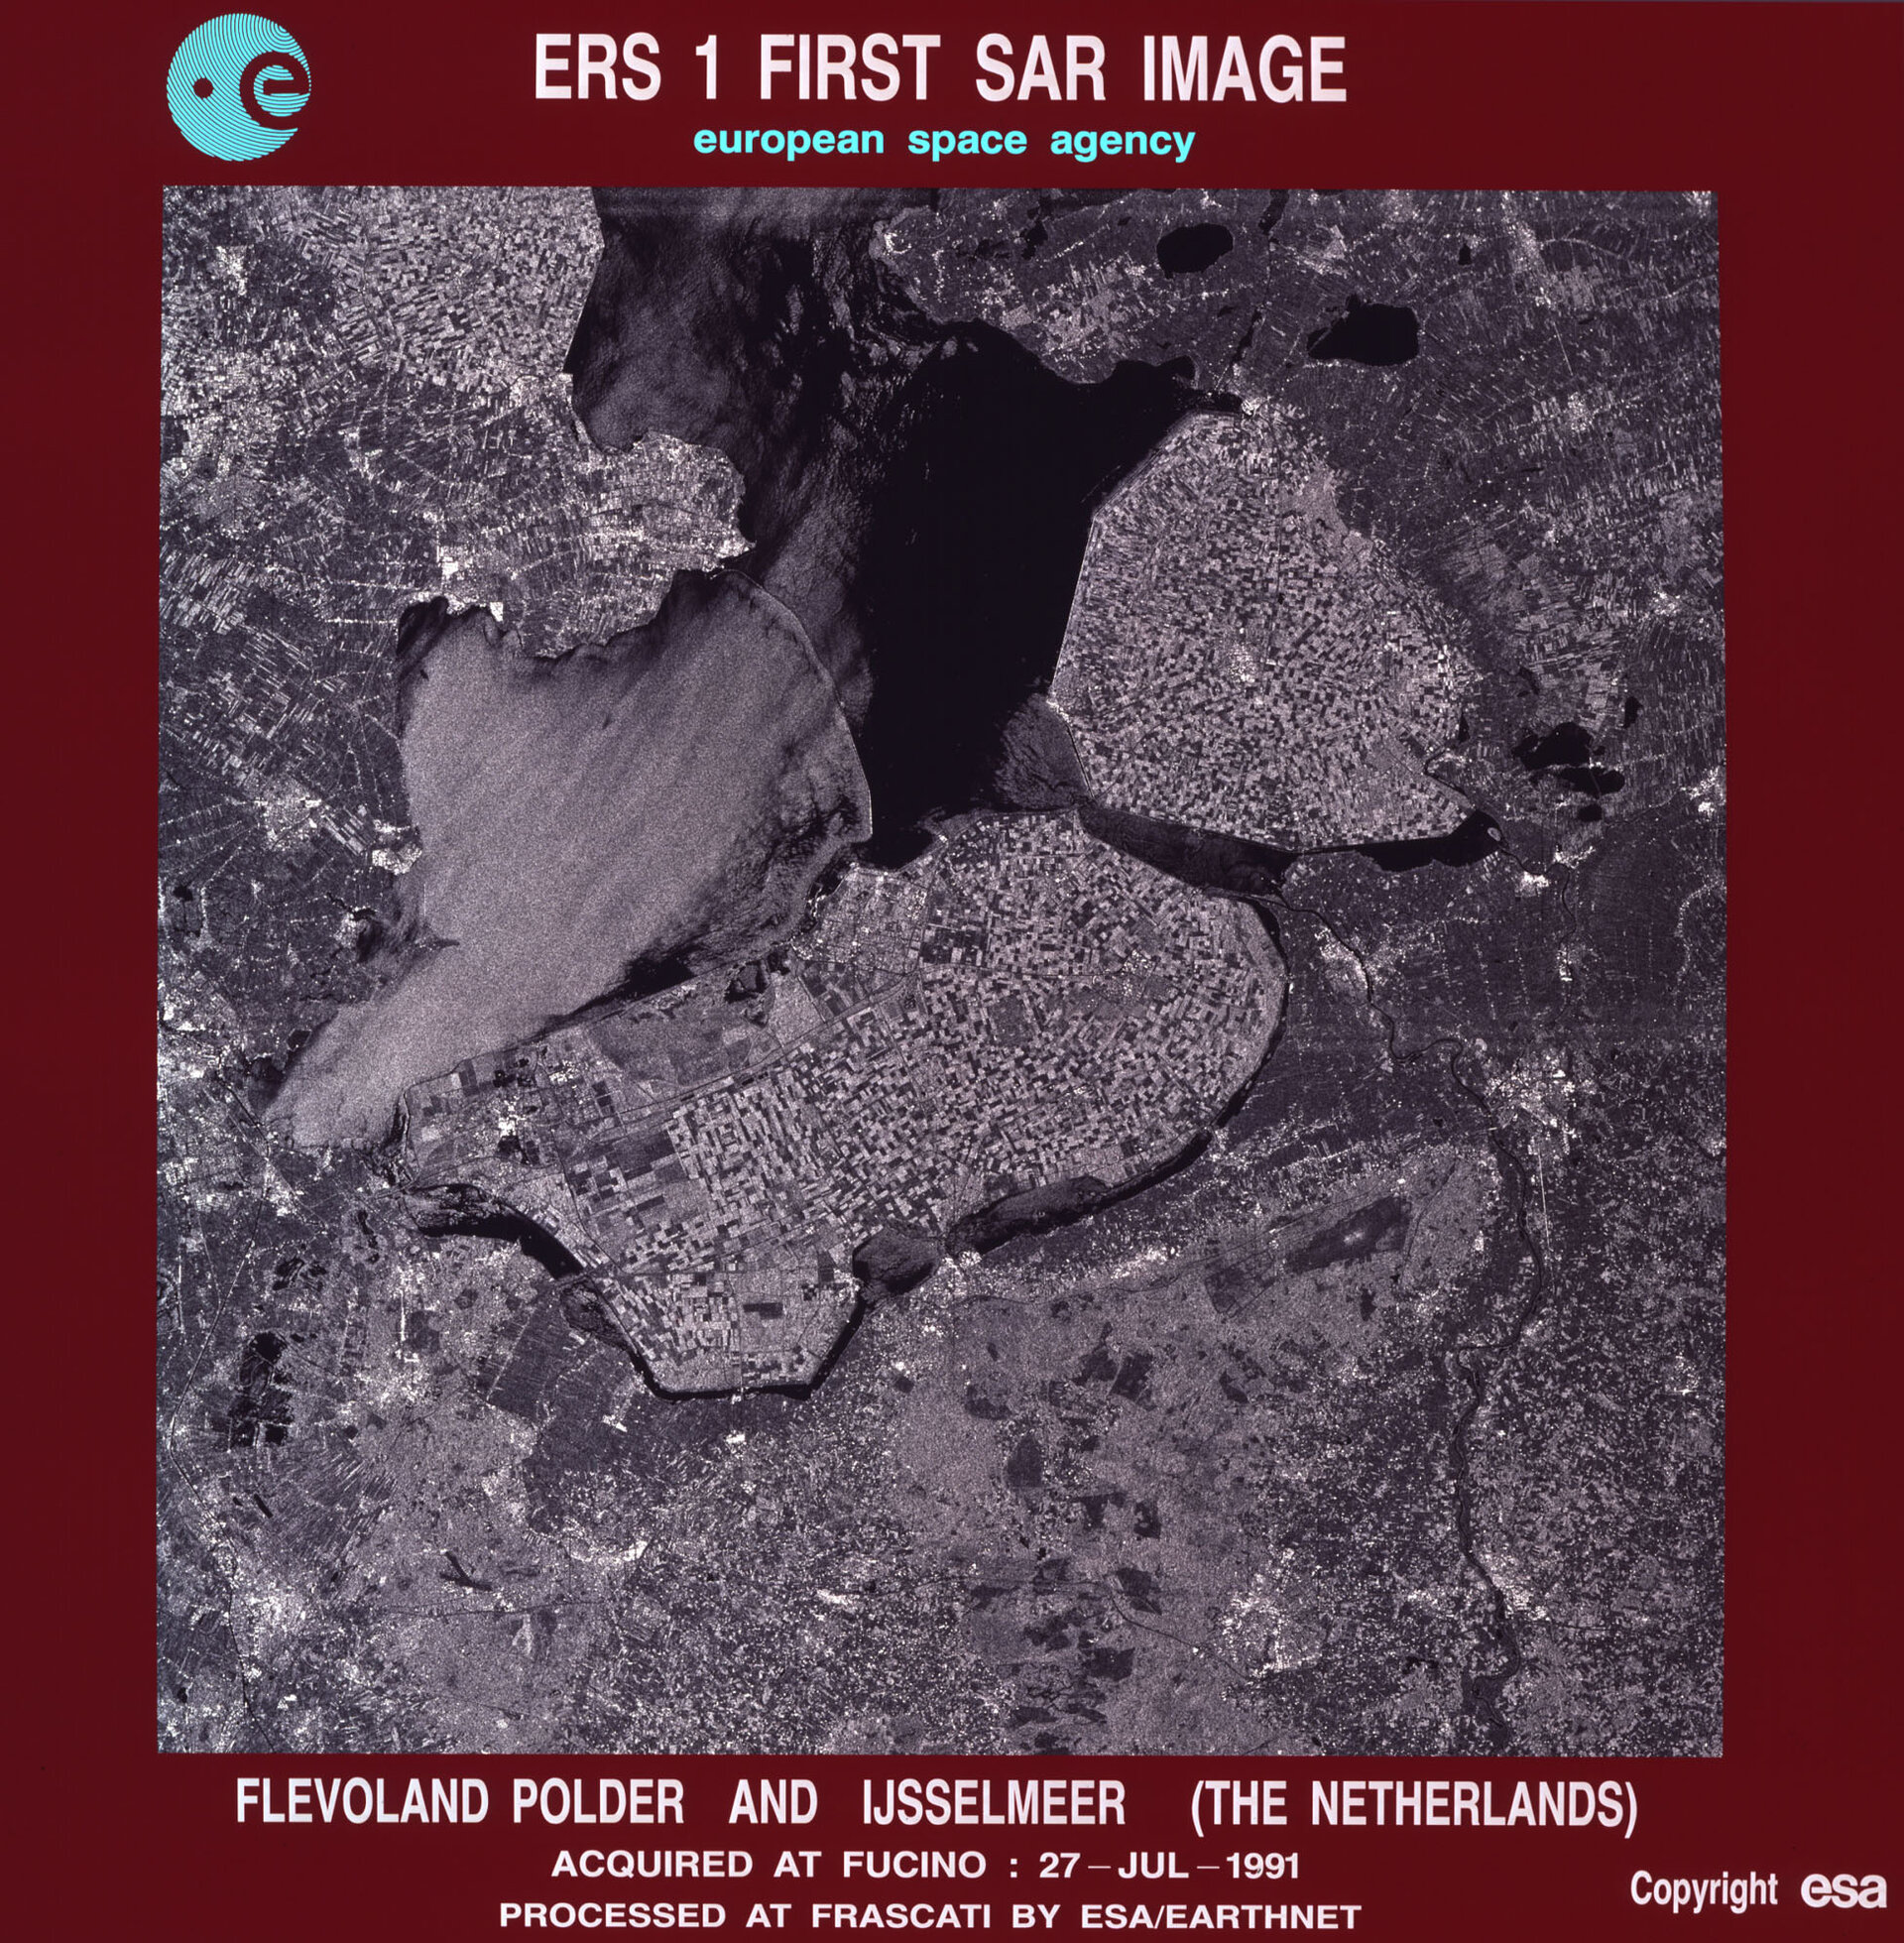
The European Remote Sensing satellite ERS-1, launched in 1991, carried a comprehensive payload including an imaging synthetic aperture radar, a radar altimeter and other powerful instruments to measure ocean surface temperature and winds at sea. ERS-2, which overlapped with ERS-1, was launched in 1995 with an additional sensor for atmospheric ozone research.
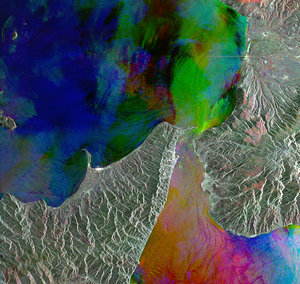
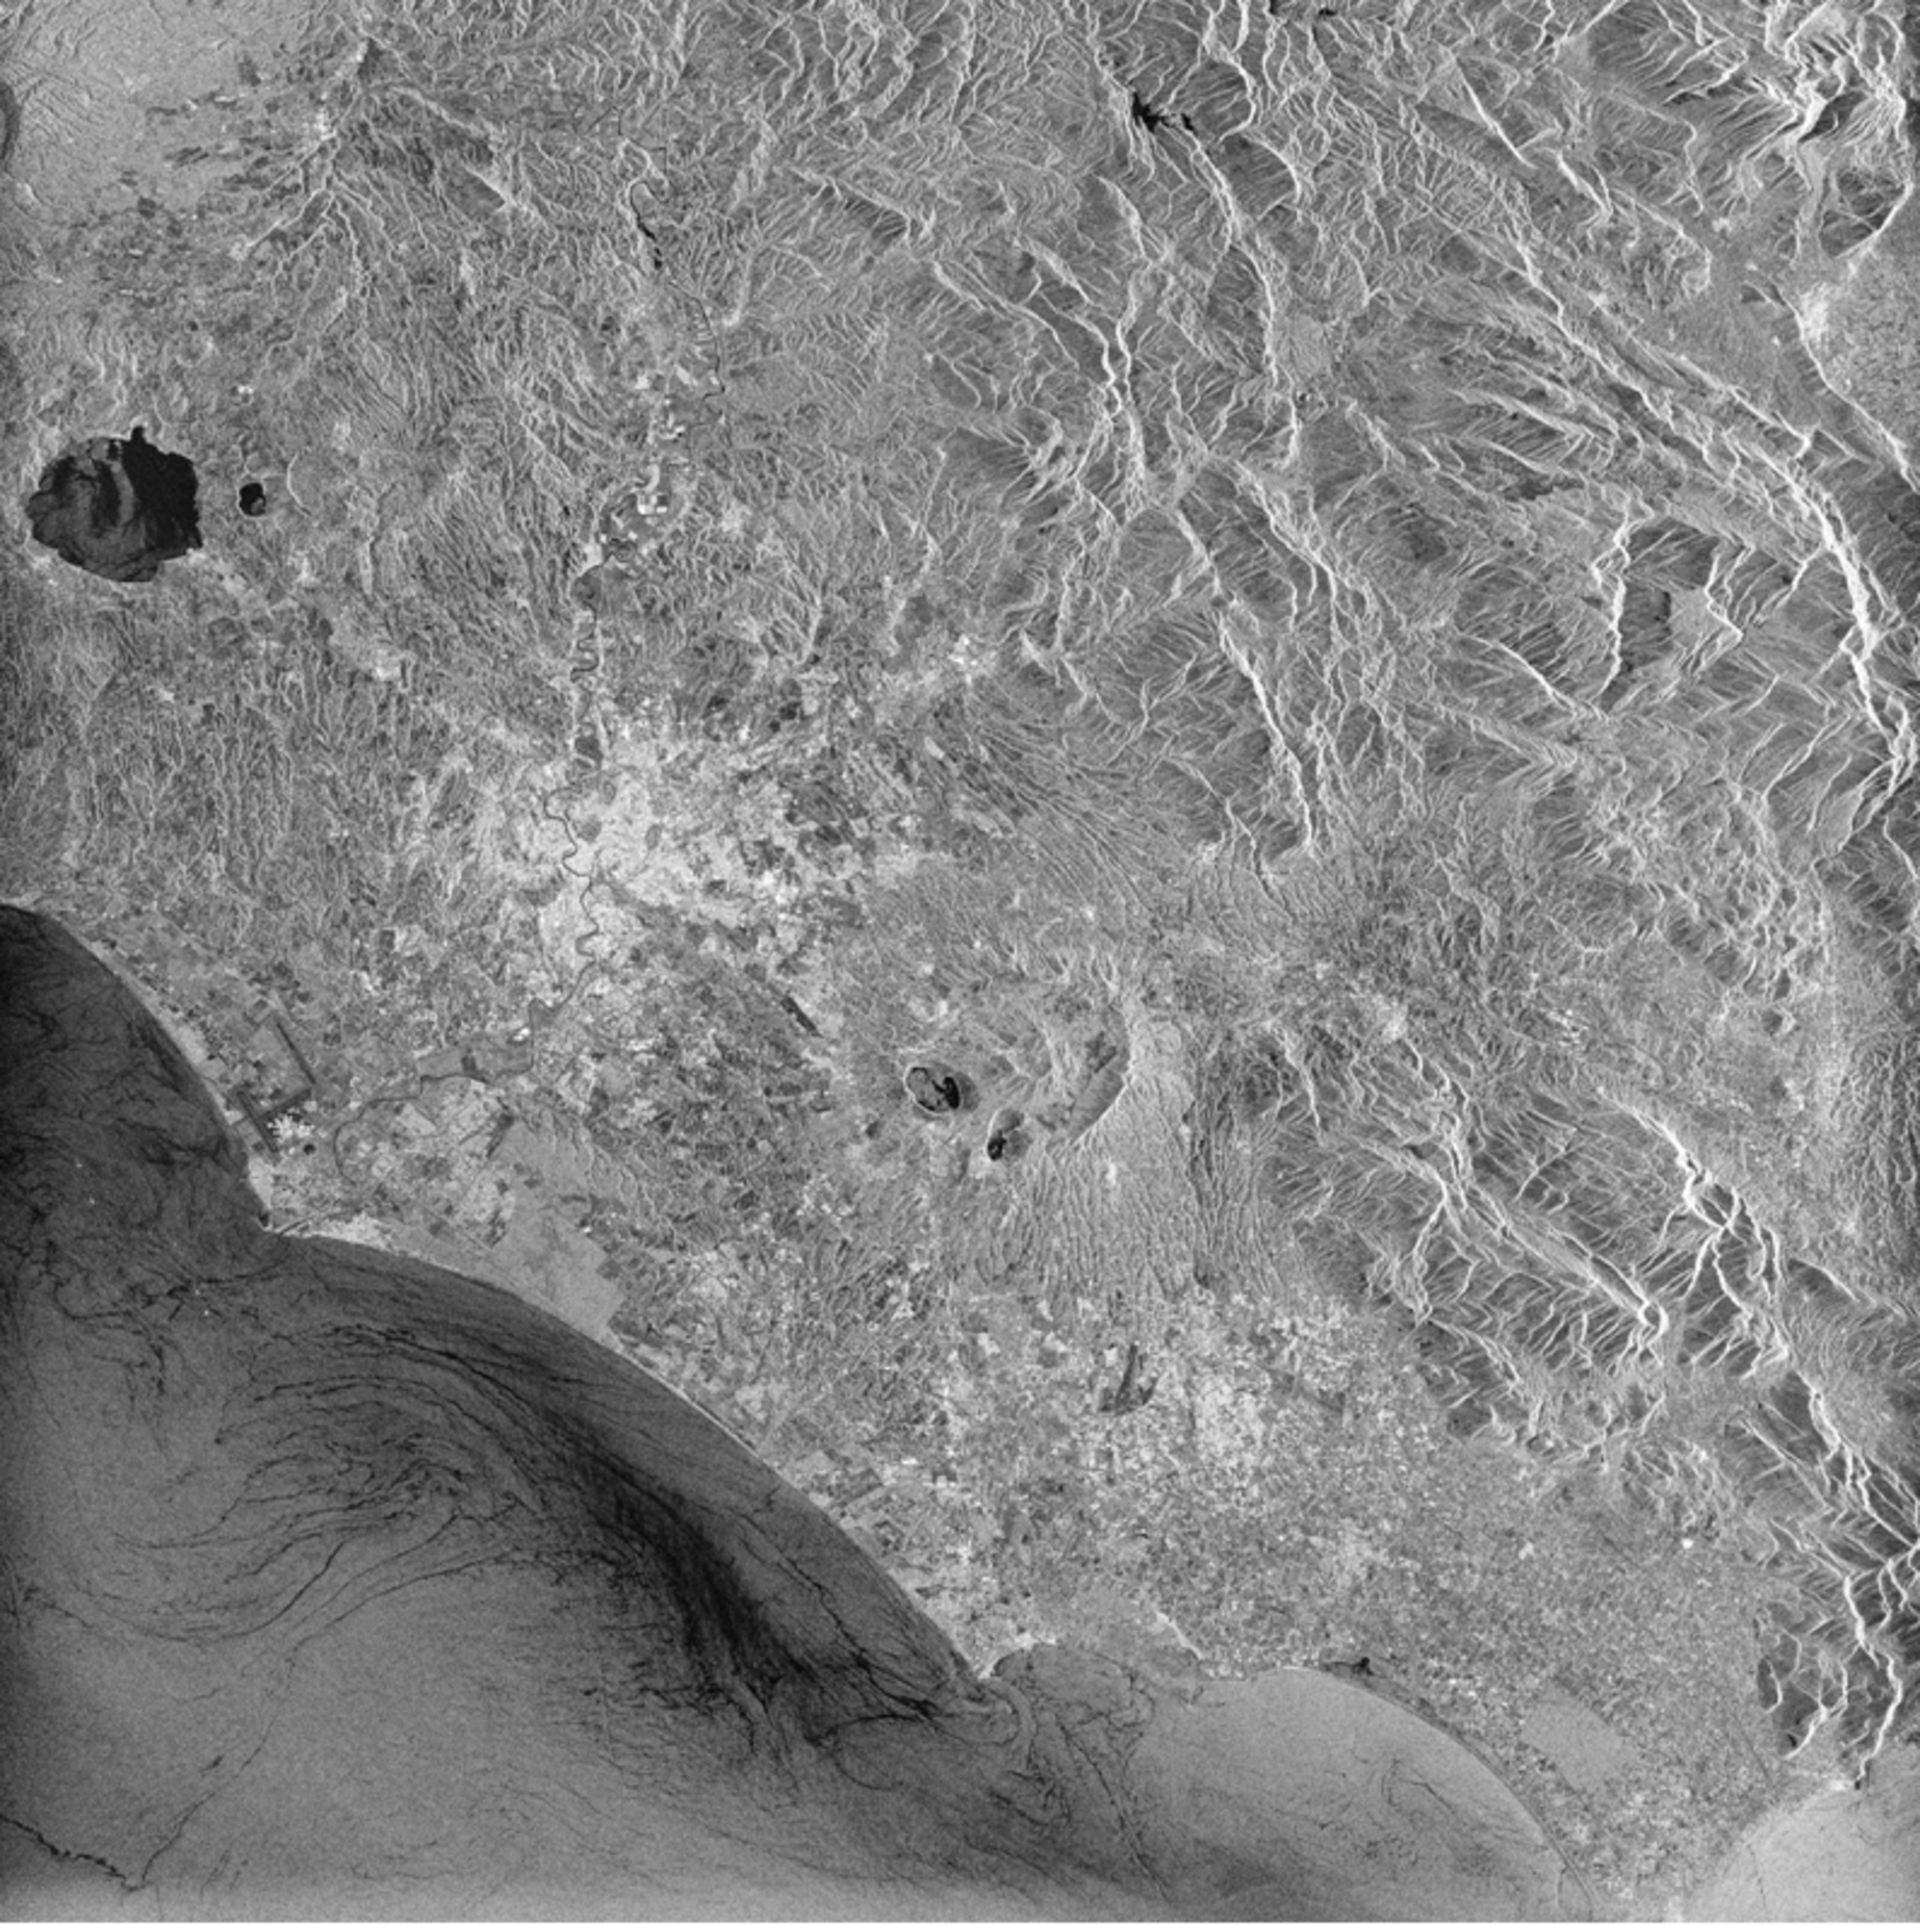
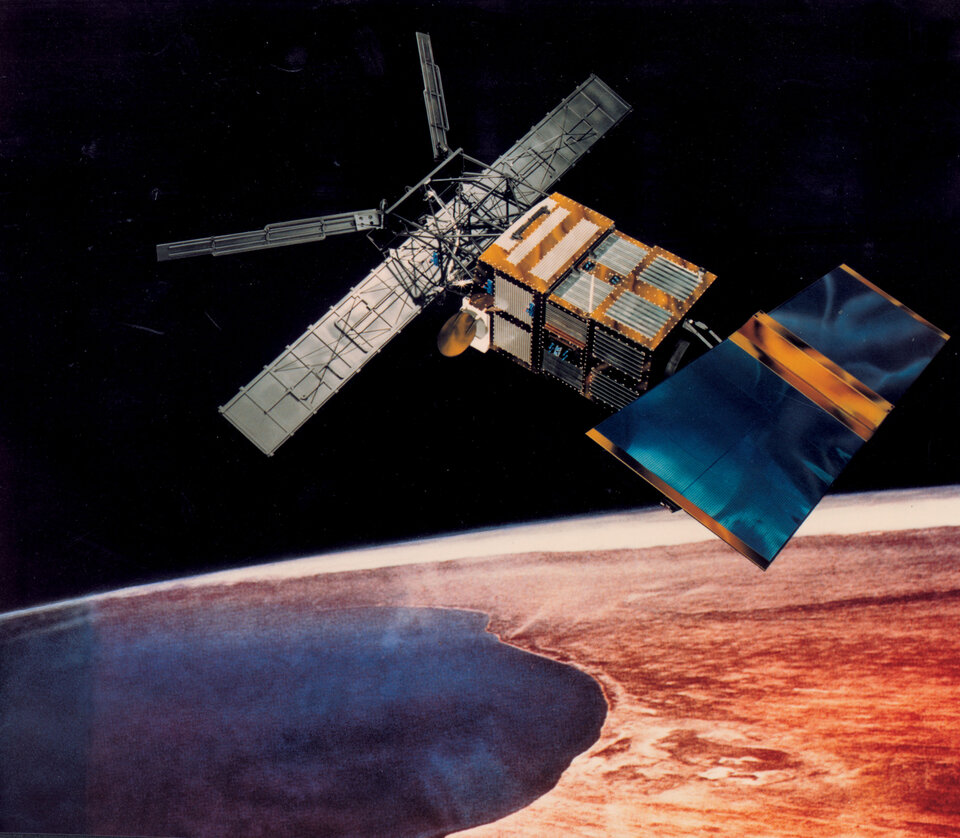
At their time of launch the two ERS satellites were the most sophisticated Earth observation spacecraft ever developed and launched by Europe. These highly successful ESA satellites collected a wealth of valuable data on Earth’s land surfaces, oceans and polar caps and were called upon to monitor natural disasters such as severe flooding or earthquakes in remote parts of the world.
Both ERS satellites were built with a core payload of two specialised radars and an infrared imaging sensor. The two were designed as identical twins with one important difference: ERS-2 included an extra instrument to monitor ozone levels in the atmosphere.
Shortly after the launch of ERS-2 in 1995 ESA decided to link the two satellites in the first ‘tandem’ mission which lasted for nine months. During this time the increased frequency and level of data available to scientists offered a unique opportunity to observe changes over a very short space of time, as both satellites orbited Earth only 24 hours apart.
In March 2000, a computer and gyro control failure led to ERS-1 finally ending its operations, after far exceeding its planned lifetime.
In July 2011, ESA took the decision to retire also ERS-2 and the process of deorbiting the satellite began. On 21 February 2024, ERS-2 reentered Earth's atmosphere over the North Pacific Ocean.
During their lifetime, ERS data supported over 5000 projects producing some 4000 scientific publications. Archived data still to this day provide us with a wealth of information and are maintained accessible and continuously improved in the frame of the Heritage Space Programme to build long-term data series with successor missions including Envisat, ESA's family of Earth Explorers and the Copernicus Sentinels.
| ERS-1 | ERS-2 | ||
|---|---|---|---|
| Launch |
from Kourou, French Guiana |
17 July 1991 | 21 April 1995 |
| Launcher | Ariane 4 | ||
| Launch mass | 2384 kg | 2516 kg | |
| Number of instruments |
4/5 including SAR with GOME added to ERS-2 |
||
| Orbit |
Sun synchronous, altitude 800 km |
||
| Inclination | 98.5 degrees | ||
| Time for one orbit | 100 minutes | ||
| Cycle | 35-day repeat |