Agency
Two fault variable-slip model of the Bam earthquake
Two fault variable-slip model of the Bam earthquake.
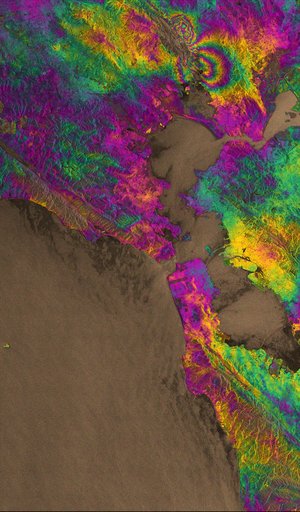
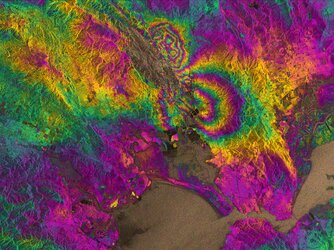
(a) Model ascending interferogram.
(b) Model descending interferogram. [Black lines
represent the surface traces of the faults when projected to the surface.]
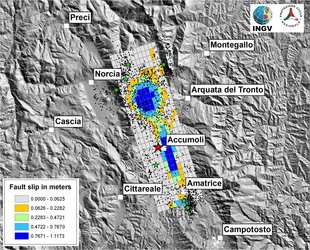
(c) Left: distribution of slip on the main fault. Right: distribution of slip on both faults. Viewing position is from the NE. [Red lines: fault surface traces].