United space in Europe
Global methane
Applications

Global methane

04/09/2013 2095 views 17 likes 296376 ID
  • HI-RES PNG [4.59 MB]

Thank you for liking

You have already liked this page, you can only like it once!

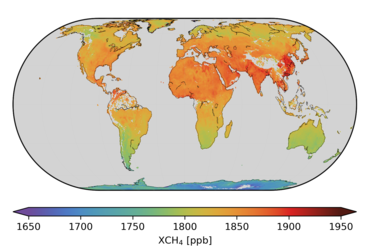
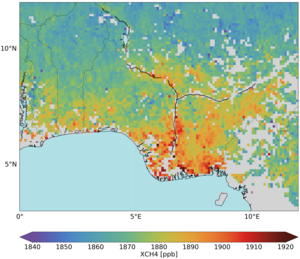
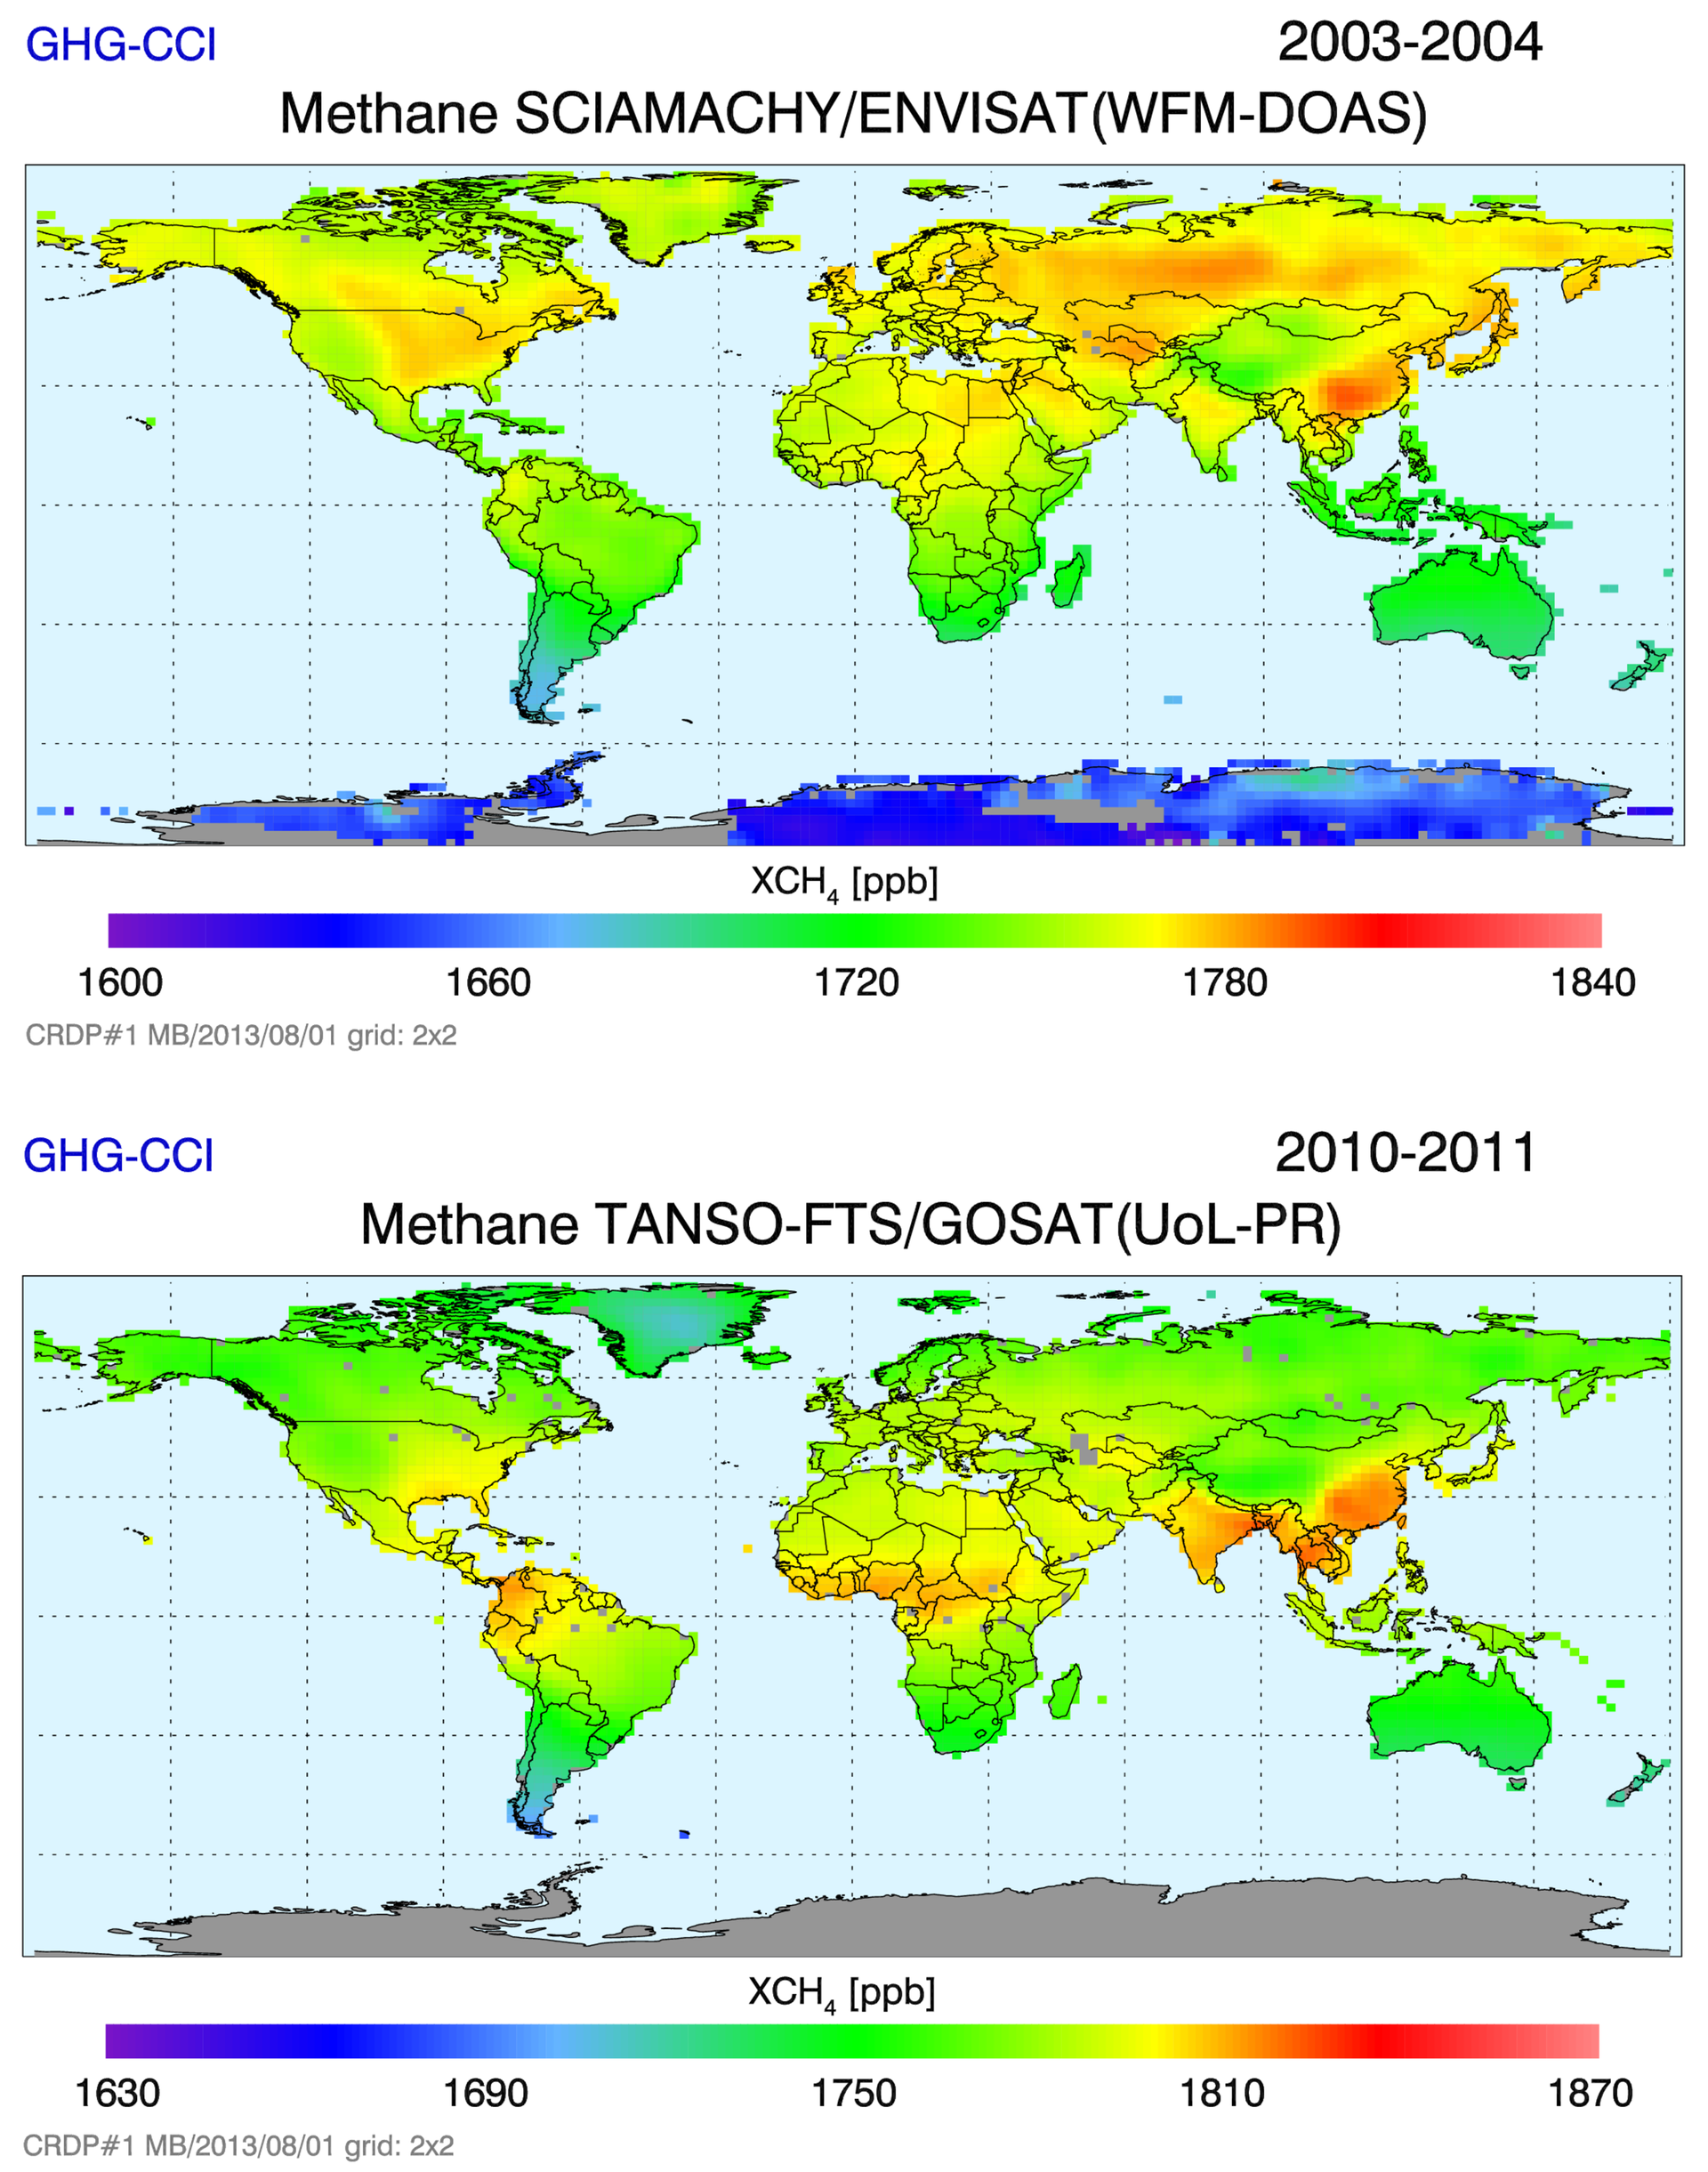
Global distributions of atmospheric methane as retrieved from the Sciamachy instrument on Envisat covering 2003–04 (top) and the TANSO instrument on Japan’s GOSAT from 2010–11 (bottom). High values (yellow to red) correspond to major source regions such as China (e.g., emissions from rice cultivation), Siberia (emissions from wetlands) and parts of the US (e.g., emissions from gas and coal mining, wetlands). During 2010–11 (bottom) the average global methane is approximately 30 parts per billion higher than in 2003–04 (top). Note: the colour scale changes between the two images.

  • University Bremen/ESA
  • Observing the Earth
  • Envisat
  • Sciamachy
  • Methane Atmosphere Climate Change
Methane levels increase
Applications

Methane levels increase

Image 3744 views 32 likes
Global methane
Applications

Global methane

Image 2068 views 20 likes
Global atmospheric methane distribution measured by SCIAMACHY
Applications

Global atmospheric methane distribution measured by…

Image 1377 views 8 likes
Methane over wetlands in Nigeria
Applications

Methane over wetlands in Nigeria

Image 666 views 3 likes
Carbon dioxide on the rise
Applications

Carbon dioxide on the rise

Image 4055 views 35 likes