First radargram from Juice’s RIME instrument
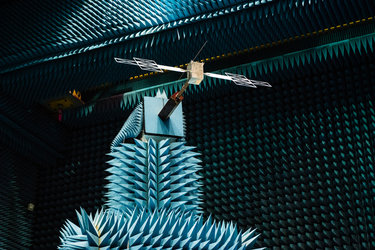
When ESA’s Jupiter Icy Moons Explorer (Juice) flew past our own Moon in August 2024, the spacecraft’s ten science instruments were switched on and tested out for the first time on an actual surface in space.
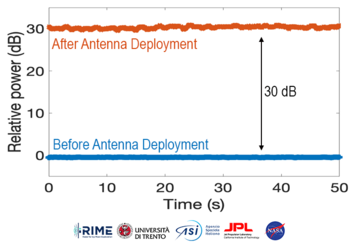
This test was particularly important for Juice’s Radar for Icy Moon Exploration (RIME) instrument, as electronic noise within the rest of the spacecraft is unexpectedly disturbing the sensitive device.
As Juice made its closest approach to the Moon, RIME was given eight minutes to observe alone, with other instruments either switched off or set to quiet mode. RIME sent out radio waves and listened out for their echoes from the Moon’s surface 750 km away. Similar to how an ultrasound works on the human body, the returning radio wave signals were processed to create an image. The result – RIME’s first-ever ‘radargram’ – reveals the height of the surface below.
Here, we compare RIME’s view (left) with an elevation model from NASA’s Lunar Orbiter Laser Altimeter (right). The bright pink-to-yellow line that wiggles across the dark purple background traces out the height of the Moon’s surface as RIME flew directly overhead.
The white line in the elevation map shows the path of Juice over the surface of the Moon. In the radargram, the horizontal axis follows this path, and the vertical axis shows how far away the Moon’s surface is from the spacecraft, giving us information on the height of the surface.
The bumps and dips in the RIME data clearly match up with the height of the land in LOLA’s elevation map. This is particularly evident over the Pasteur crater and the higher land surrounding this hollow in the Moon’s surface.
[Image description: Left: A purple scene with a pink-to-yellow line wiggling across it, with tiny faint pink dots scattered around. The line looks like a heart rate graph but much more irregular, with a particularly large dip on the right. Right: A height map of the Moon's surface in green-orange-red colours, with a white line crossing the map horizontally.]