| | | | |
 |
|
Earthquakes IntroductionIzmit earthquakeFloods Thessaloniki (Greece)Hurricanes Storm surgesHurricane KatrinaVolcanoes IntroductionAndean Volcanic BeltEtnaNyiragongo and Nyamuragira
| | | | | | | Exercise 1: Exploring and learning about the volcano - continued
Click on the Histogram icon: The histogram shows the distribution of the grey values. As the image is recorded in an 8 bit format, each band consists of 256 grey values. The 256 grey values are displayed on the horizontal axis, and on the vertical axis the number of pixels having this grey value. Only some parts of the available colour space from 0 - 255 are used here. Using the cursor you can see the number of pixels and percentage of a certain grey value (see tutorial p.16 onwards).
Go to Image > Measurement Tool and draw four lines at the borders of the image. By switching between displaying the values for pixels or metres, you can get an idea of how large your area is. One way to get information about a single pixel is to use the cursor.
5. Calculate the extension (height and width in m) and area (m²) for the image.
6. Estimate the diameter of the Nyamuragira volcano.
Go to View > Curser Position/Value. The window displays the image coordinates, grey value, UTM coordinates and geographic coordinates.
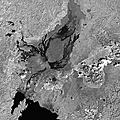
| | Band 4 (near-infrared) of Landsat image of 11 December 2001 | |
Contrast Enhancement
As mentioned before, not the whole colour space is used, and the images seem to have low contrast. We will therefore stretch the image. Stretching means stretching the image histogram and distributing the values over a larger range of grey values (max. 0-255), improving the contrast. Choose one band.
Go to Enhance > Interactive Stretching, and drag the blue and pink vertical lines to the borders of the histogram. If you open the histogram of the image again, the appearance is now different. The values have been stretched over the possible space of 256 grey values but now have gaps in between them. Save the image with the band number and the suffix _stretched (for example etna_1999-09-26_band1_stretched.tif) by choosing Image > Save As (see LEOWorks tutorial p. 38).
Go to Image > Profile X (or Profile Y or both). If you open the same band stretched and unstretched you can compare the profiles of the two images, showing your pixel values before and after the stretch in X or Y direction. (see LEOWorks tutorial p. 32).
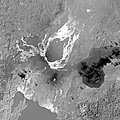
| | | Band 6 of Landsat image of 11 December 2001 |
Have a closer look at some bands after contrast enhancement. Here we compare band 4 and band 6 of Landsat:
7. Try to find volcanic features like lava flows, craters, and cones.
8. What are the image features with low values (almost black) in bands 4 and 6?
9. What are the image features with high values (almost white) in bands 4 and 6?
10. What could explain the appearance of volcanic lava?
11. Can you explain how clouds and cloud shadows are displayed in the respective images?
12. What is the white dot in the middle of the Nyiragongo crater in band 6?
| |
| | Nyiragongo and Nyamuragira IntroductionChange detection and hazard assessment Worksheet introductionExercise 1: Exploring and learning about the volcanoExercise 2: Lava Detection using Supervised ClassificationExercise 3: Multitemporal Change Detection and MonitoringEduspace - Download Nyiragongo_Landsat.zipEduspace - Software LEOWorks 3LEOWorks 3 Tutorial
|