Exercise 3: Lava detection: crisis images and maps
Eruptions of 2001 and 2002-2003
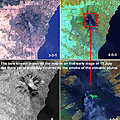
This exercise concentrates on the 2001 and 2002-2003 eruptions respectively. We will now examine a pre-crisis image. Two images of the 2001 crisis have been prepared to show examples of volcanic effects in satellite images.
|  | False Colour Composites (FCC) of the Landsat images of 13 July 2001 | |
Go to File > Open and open the image etna_2001-07-13_all. Here all the bands have already been combined in one file, so the band combination must be specified.
Select > RGB and start with band 3-2-1. Then have a look at 4-3-2 and other FCCs incorporating mid-infrared, e.g. 4-5-3 or 7-4-2.
Take some time to inspect the images like you did for the 1999 images.
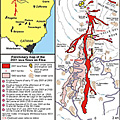
| | | Lava map of the 2001 eruption |
Open the following three items:
File > Open > etna_2001-07-13_all > RGB 4-5-3
File > Open > band 6 of etna_2001-07-13_all (= thermal band)
File > Open > lavamap_2001_etna.jpg eruption
1. Where can you find hot lava?
2. Where can you best see the plume?
3. What appears dark in the thermal image (band 6)?
4. What appears light in the thermal image (band 6)?
5. Compare the lava map to the FCC and the thermal image. Can you see parts of the lava on the map in the two images? Why can you/can you not see the lava?
|