Exercise 3: Lava detection: crisis images and maps - continued
At this stage, most of the lava has already spread, but not all. The eruption lasted until around 9 August. The 2001 lava in the western part is not seen in the FCCs, although it is already marked on the map.
The lava is still visible in band 6 (hot = white) but no longer distinguishable from others in mid-IR. In the 4-5-3 combination, many dark coloured lava streams can be seen, but only in band 6 can the new one be identified and distinguished from the others. Snow is clearly detectable (cold = dark). In band 6 you cannot see any more hot lava in the western area, as it was not there yet at that point in time. See the lava map for comparison.
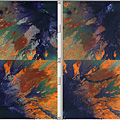
|  | Landsat 1999 vs. 2003 FCC 4-5-3 | |
Changes from 1999 – 2003
We will now work with a post-crisis image after the end of the eruptions from November 2002 to January 2003. This image contains all the changes from 2001 and 2002/03 compared to the image of 1999.
File > Open > RGB 4-5-3
File > Open > etna_1999-09-26_all.tif > RGB 4-5-3
Enhance > Interactive Stretching (for both)
File > Open > lavamap_2002-03_etna.jpg
Look at the Image Information and check if the projection is the same in both images.
15. Why does the 2003 data consist of only 7 bands and is missing band 8?
16. Can you detect volcanic activity in the 2003 image?
17. Can you identify any new lava flows?
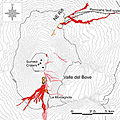
| | | Lava map of the 2002 - 2003 eruption |
18. Compare with the lava map from 2001: Can you identify lava from the 2001 eruptions?
19. Compare with the lava map from 2002/03: Can you identify any new lava?
Display some colour composites or bands of 1999 and 2003 next to each other and compare them (e.g. 4-5-3).
|