| | Urbanisation – 40 years of urban development of Lhasa
This exercise does not require the use of LEOWorks.
Download the necessary data from Himalayas_env2.zip.
Cities develop and grow larger. Modernisation processes occur in cities and towns all over the world. The former capital of Tibet is also undergoing dramatic urbanisation processes.
1. What is urbanisation?
2. What are the reasons behind urbanisation?
3. What happens to cities which undergo urbanisation processes?
4. Do you live in a city or in the countryside?
5. Do you know the approximate urbanisation rate of your country?
In this exercise we will investigate the development of Lhasa, today’s capital of the Tibet Autonomous Region. As previously mentioned, Lhasa’s population has increased seven-fold, and its surface has increased even more.
The following satellite images were taken with a time gap of 40 years in between. The first image was taken in 1965 by an American spy satellite. The name of the programme was 'Corona', and it ran until 1972, with a spatial resolution of up to 1.8 m. Today it is of great importance for time-based investigations.
The second image shows the city of Lhasa as it is today. It was taken in 2005 by a commercial satellite with a spatial resolution of less than 1 metre.
These two images give us a good idea of what happened to Lhasa between 1965 and 2005.
Produce a print copy of both 'lhasa_1965.tif' and 'lhasa_2005.tif'.
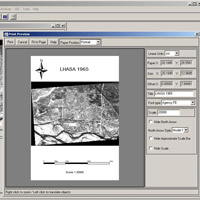
You can use LEOWorks to do this. To do so, open the images one by one and click on the print icon. For the scale, manually enter 20 000 (see the image below). Change the title to 'LHASA 1965' (do the same for 'LHASA 2000') and, if necessary, rearrange the title and scale bar. Print the image.
'Lhasa 1965' in LEOWorks
First of all, try to find features such as a prominent road crossing near the centre of the image. Identify the historic centre, where the houses have the highest densities. Observe the area towards the periphery. We can see, with the naked eye, that the city has changed, and that built-up areas have increased. Just look at the eastern parts of the city and you will see that the unspoilt area of 1965 has turned into an urban area.
1. Observe the city and the surrounding area, and look for the changes that occurred between 1965 and 2000.
2. Describe what has happened to the city.
3. When you look closely at the old town, you can see that not only has the density of buildings risen, in some parts buildings have even been removed. If available, use a magnifying glass.
Removal of a building structure
4. When you look closer at the southern part of the images, you can see that the riverbank has changed. Describe what has changed and try to give reasons for the change.
| |