Cassini 'tastes' organic brew at Saturn’s geyser moon
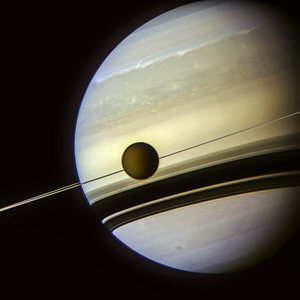
The Cassini spacecraft tasted and sampled a surprising organic brew erupting in geyser-like fashion from Saturn's moon Enceladus during a close flyby on 12 March. Scientists are amazed that this tiny moon is so active, ‘hot’ and brimming with water vapour and organic chemicals.
New heat maps of the surface show higher temperatures than previously known in the south polar region, with hot tracks running the length of giant fissures. Additionally, scientists say the organics ‘taste and smell’ like some of those found in a comet. The jets themselves harmlessly peppered Cassini, exerting measurable torque on the spacecraft, and providing an indirect measure of the plume density.
"A completely unexpected surprise is that the chemistry of Enceladus, what's coming out from inside, resembles that of a comet," said Hunter Waite, principal investigator for the Cassini Ion and Neutral Mass Spectrometer at the Southwest Research Institute in San Antonio. "To have primordial material coming out from inside a Saturn moon raises many questions on the formation of the Saturn system."
"Enceladus is by no means a comet. Comets have tails and orbit the sun, and Enceladus's activity is powered by internal heat while comet activity is powered by sunlight. Enceladus's brew is like carbonated water with an essence of natural gas," said Waite.
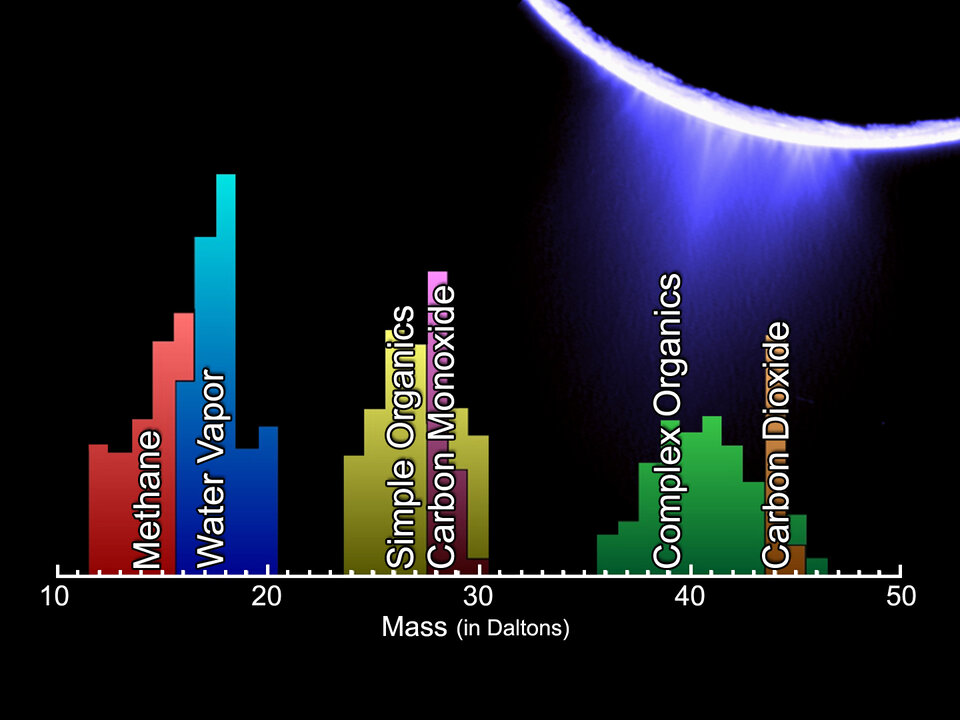
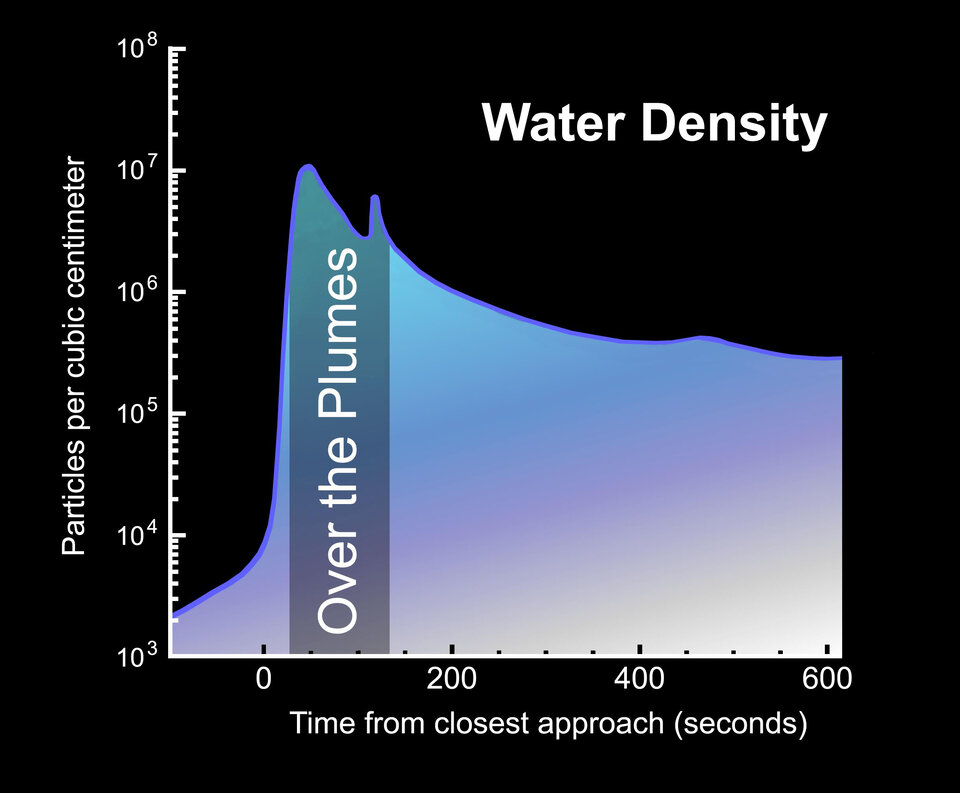
The Ion and Neutral Mass Spectrometer saw a much higher density of volatile gases, water vapour, carbon dioxide and carbon monoxide, as well as organic materials, some 20 times denser than expected. This dramatic increase in density was evident as the spacecraft flew over the area of the plumes.
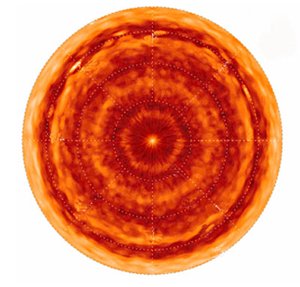
New high-resolution heat maps of the south pole by Cassini's Composite Infrared Spectrometer show that the so-called tiger stripes, giant fissures that are the source of the geysers, are warm along almost their entire lengths, and reveal other warm fissures nearby. These more precise new measurements reveal temperatures of at least minus 93º Celsius. That is 17º warmer than previously seen and 93º Celsius warmer than other regions of the moon. The warmest regions along the tiger stripes correspond to two of the jet locations seen in Cassini images.

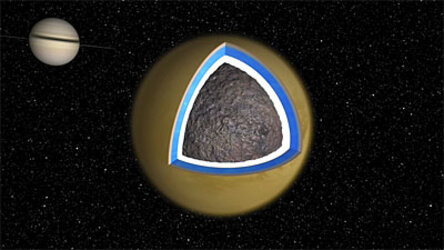
"These spectacular new data will really help us understand what powers the geysers. The surprisingly high temperatures make it more likely that there's liquid water not far below the surface," said John Spencer, Cassini scientist on the Composite Infrared Spectrometer team at the Southwest Research Institute in Colorado, USA.
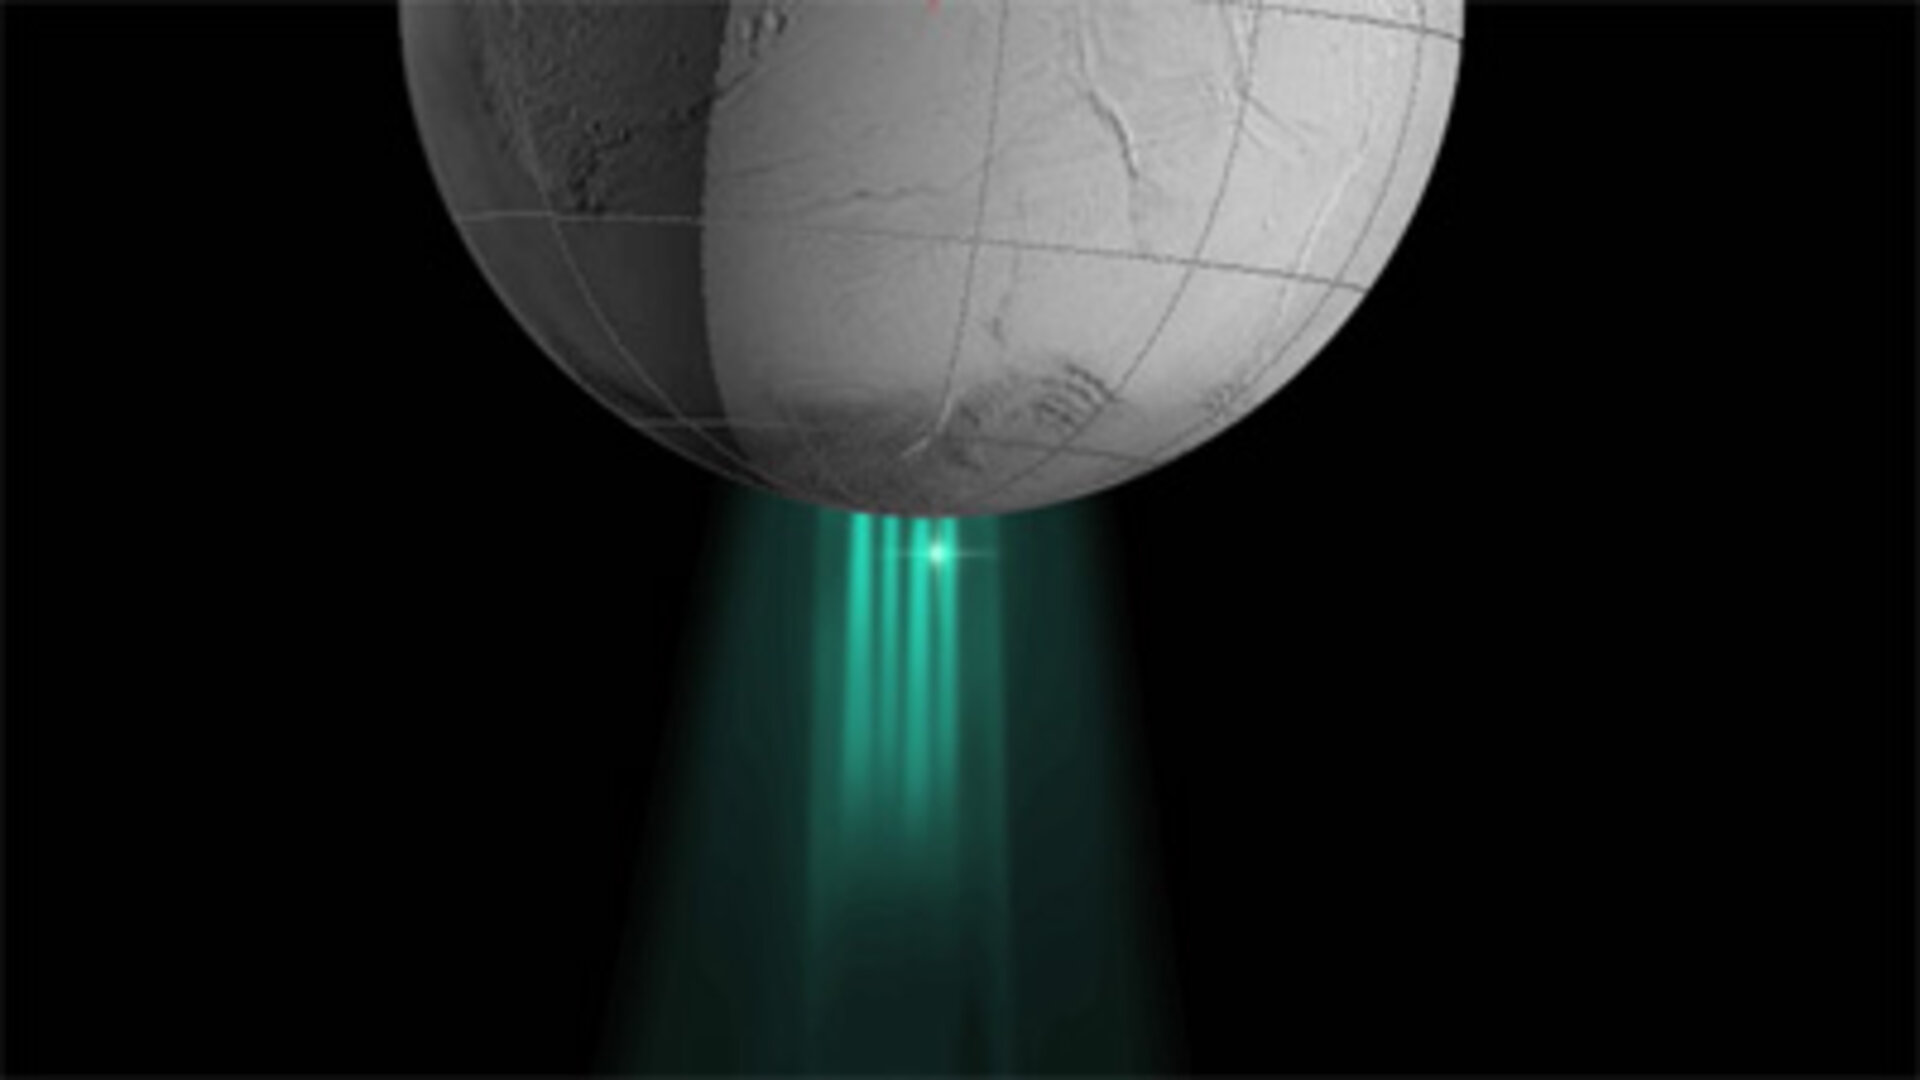
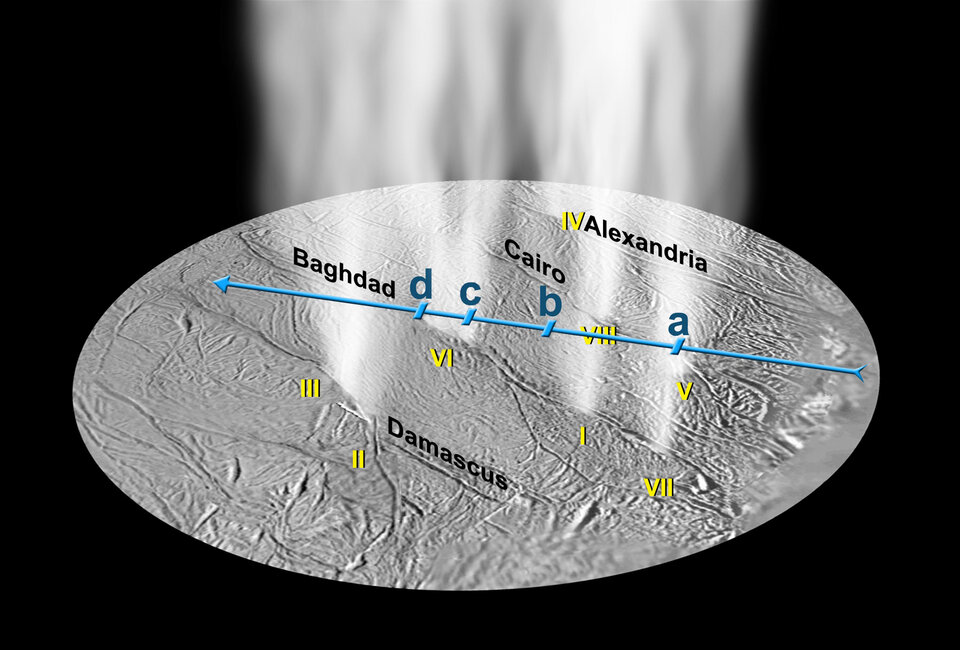
Previous ultraviolet observations showed four jet sources, matching the locations of the plumes seen in previous images. This indicates that gas in the plume blasts off the surface into space, blending to form the larger plume.

Images from previous observations show individual jets and mark places from which they emanate. New images show how hot spot fractures are related to other surface features. In future imaging observations, scientists hope to see individual plume sources and investigate differences among fractures.
"Enceladus has got warmth, water and organic chemicals, some of the essential building blocks needed for life," said Dennis Matson, Cassini project scientist at NASA's Jet Propulsion Laboratory in California, USA. "We have quite a recipe for life on our hands, but we have yet to find the final ingredient, liquid water, but Enceladus is only whetting our appetites for more."

At closest approach, Cassini was only about 48 km from Enceladus. When it flew through the plumes it was about 193 km from the moon's surface. Cassini's next flyby of Enceladus is in August.
Notes for editors:
The Cassini-Huygens mission is a cooperative project of NASA, the ESA and the Italian Space Agency. JPL, a division of the California Institute of Technology in Pasadena, USA, manages the Cassini-Huygens mission for NASA's Science Mission Directorate, Washington.
The Cassini orbiter was designed, developed and assembled at JPL. ESA developed the Huygens lander, while ASI managed the development of the high-gain antenna and other instruments of its participation. The radar instrument was built by JPL and the Italian Space Agency, working with team members from the United States and several European countries.