Announcing Earth observation hackathon winners
In June 2021, more than 4300 participants from 132 countries and territories came together to solve challenges related to the COVID-19 pandemic. ESA, NASA and the Japan Aerospace Exploration Agency (JAXA) are pleased to announce CleverChart and TRACER as the winners of the Open Science Award.
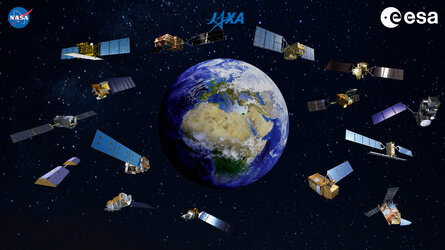
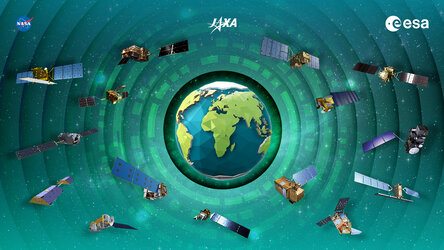
During the week-long, virtual event, coders, scientists, entrepreneurs and space enthusiasts worked together in teams to work to address several challenges related to the pandemic using openly available data on the Earth Observation Dashboard – an interactive platform that combines a wealth of data from Earth-observing satellites. The hackathon covered a wide range of topics, including air and water quality, economic, social and agricultural impacts, greenhouse gas effects with several categories awarded.
The winners of the Open Science Award were chosen as their solutions best demonstrated the use of open science principles, including transparency, inclusion, accessibility and reproducibility.
The first team, CleverChart, proposed a graphical interface that allows users to easily chart water quality changes and see the drivers of those changes. The team used water quality maps of Chlorophyll concentration and Total Suspended Matter, computed using data from the Ocean and Land Colour Instrument onboard the Copernicus Sentinel-3 mission.
CleverChart not only won the Open Science Award but was also presented with the ESA ESRIN Data Award for using ESA data the most effectively to achieve the goals of their challenge. ESRIN is ESA’s Centre for Earth Observation, located in Italy.
David von Huth, on behalf of the CleverChart team, commented, “The abundance of data available from the EuroDataCube platform enabled us as a team to think broadly about the solution we wanted to develop. Never having worked with satellite data before, there were a lot of new things that had to be learned.
“Once these initial barriers were overcome, we could think about more advanced ways of perfecting our idea. The whole experience from start to end was truly enjoyable. While being part of the winning teams was the peak of the whole experience, we think it would have been entirely worthwhile regardless of the outcome."
The other winner of the Open Science Award, TRACER (Tracer of Ship Traffic and Nitrogen Dioxide), is an interactive satellite data portal that tracks ship movement and measures air pollution in regions near shipping lanes.
This is achieved by using data from the Tropomi instrument onboard the Sentinel-5P satellite – the first Copernicus mission dedicated to monitoring our atmosphere. These data are combined with data from the Vessel Traffic Data (AIS) dataset, weather information and machine learning to predict and understand ship pollution.
The winners received certificates from NASA, ESA and JAXA and have the opportunity to integrate their findings into the Earth Observation Dashboard and the Euro Data Cube. They also receive five vouchers of $2000 to spend on ESA’s Network of Resources portfolio, an initiative to facilitate the use of Earth observation data in cloud environments. Winners are also invited to attend a launch at one of NASA’s facilities, once travel is deemed safe.
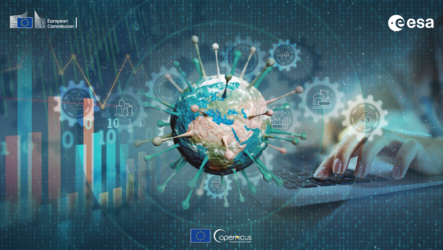
New challenges available on the Rapid Action Coronavirus Earth observation dashboard
The Rapid Action Coronavirus Earth observation dashboard, launched by ESA and the European Commission, also showcases how satellite data can contribute to measuring and understanding some of the impacts of the coronavirus lockdown on society, the economy and the environment in Europe.
Through a series of challenges released throughout 2021, the general public are invited to submit fresh ideas on how Earth observation data can contribute to monitoring the effects brought on by the pandemic.
With prizes worth up to €20 000, you are invited to propose ideas on previous themes and challenges, including transport and pollution and socio-economic indicators, or propose more creative ideas on new indicators for the dashboard. For three months, you will have access to free data, tools and support to develop and test your idea.
More information on the challenges and details on how to participate can be found on this page.