Satellites highlight a 30-year rise in ocean acidification
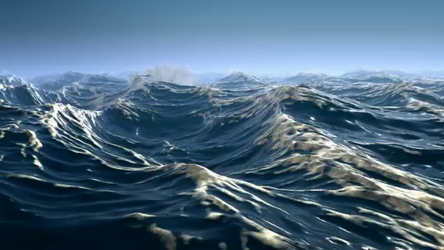
Oceans play a vital role in taking the heat out of climate change, but at a cost. New research supported by ESA and using different satellite measurements of various aspects of seawater along with measurements from ships has revealed how our ocean waters have become more acidic over the last three decades – and this is having a detrimental effect on marine life.
Oceans not only soak up around 90% of the extra heat in the atmosphere caused by greenhouse gas emissions from human activity such as the burning of fossil fuel, but also draw down about 30% of the carbon dioxide we pump into the atmosphere. While this sounds like a good thing, these processes are making seawater more acidic.
Decreasing seawater pH, or ocean acidification, leads to a reduction in the carbonate ions that calcifying organisms, such as shellfish and corals, need to build and maintain their hard shells, skeletons and other calcium carbonate structures. If the seawater pH dips too low, shells and skeletons can even begin to dissolve.
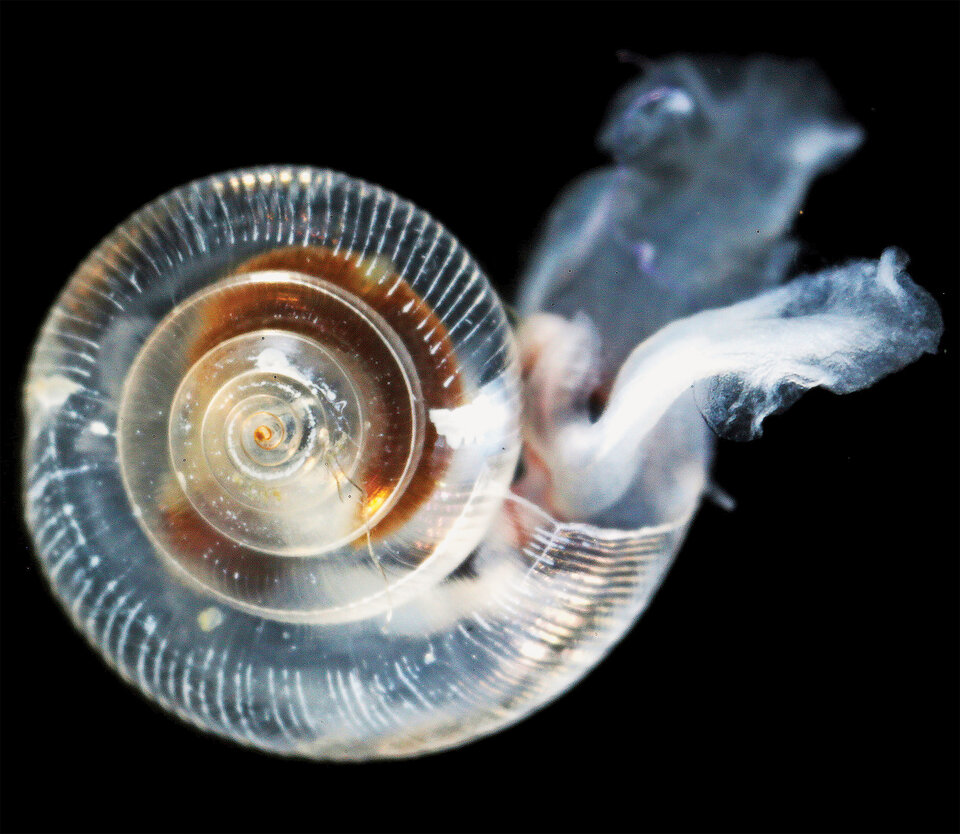
While this poses serious consequences for some forms of marine life, there are potential damaging knock-on effects for the marine ecosystem as a whole. For example, the pteropod, or sea butterfly, is being affected by ocean acidification as the change in seawater pH can dissolve their shells. They may only be little sea snails, but they are important food for organisms ranging from tiny krill to huge whales.
There are also other far-reaching consequences for us all because the health of our oceans is also important for regulating the climate, and essential for aquaculture and food security, tourism, and more.
Being able to monitor changes in ocean acidification is therefore important for climate and environmental policy-making, and for understanding the implications for marine life.
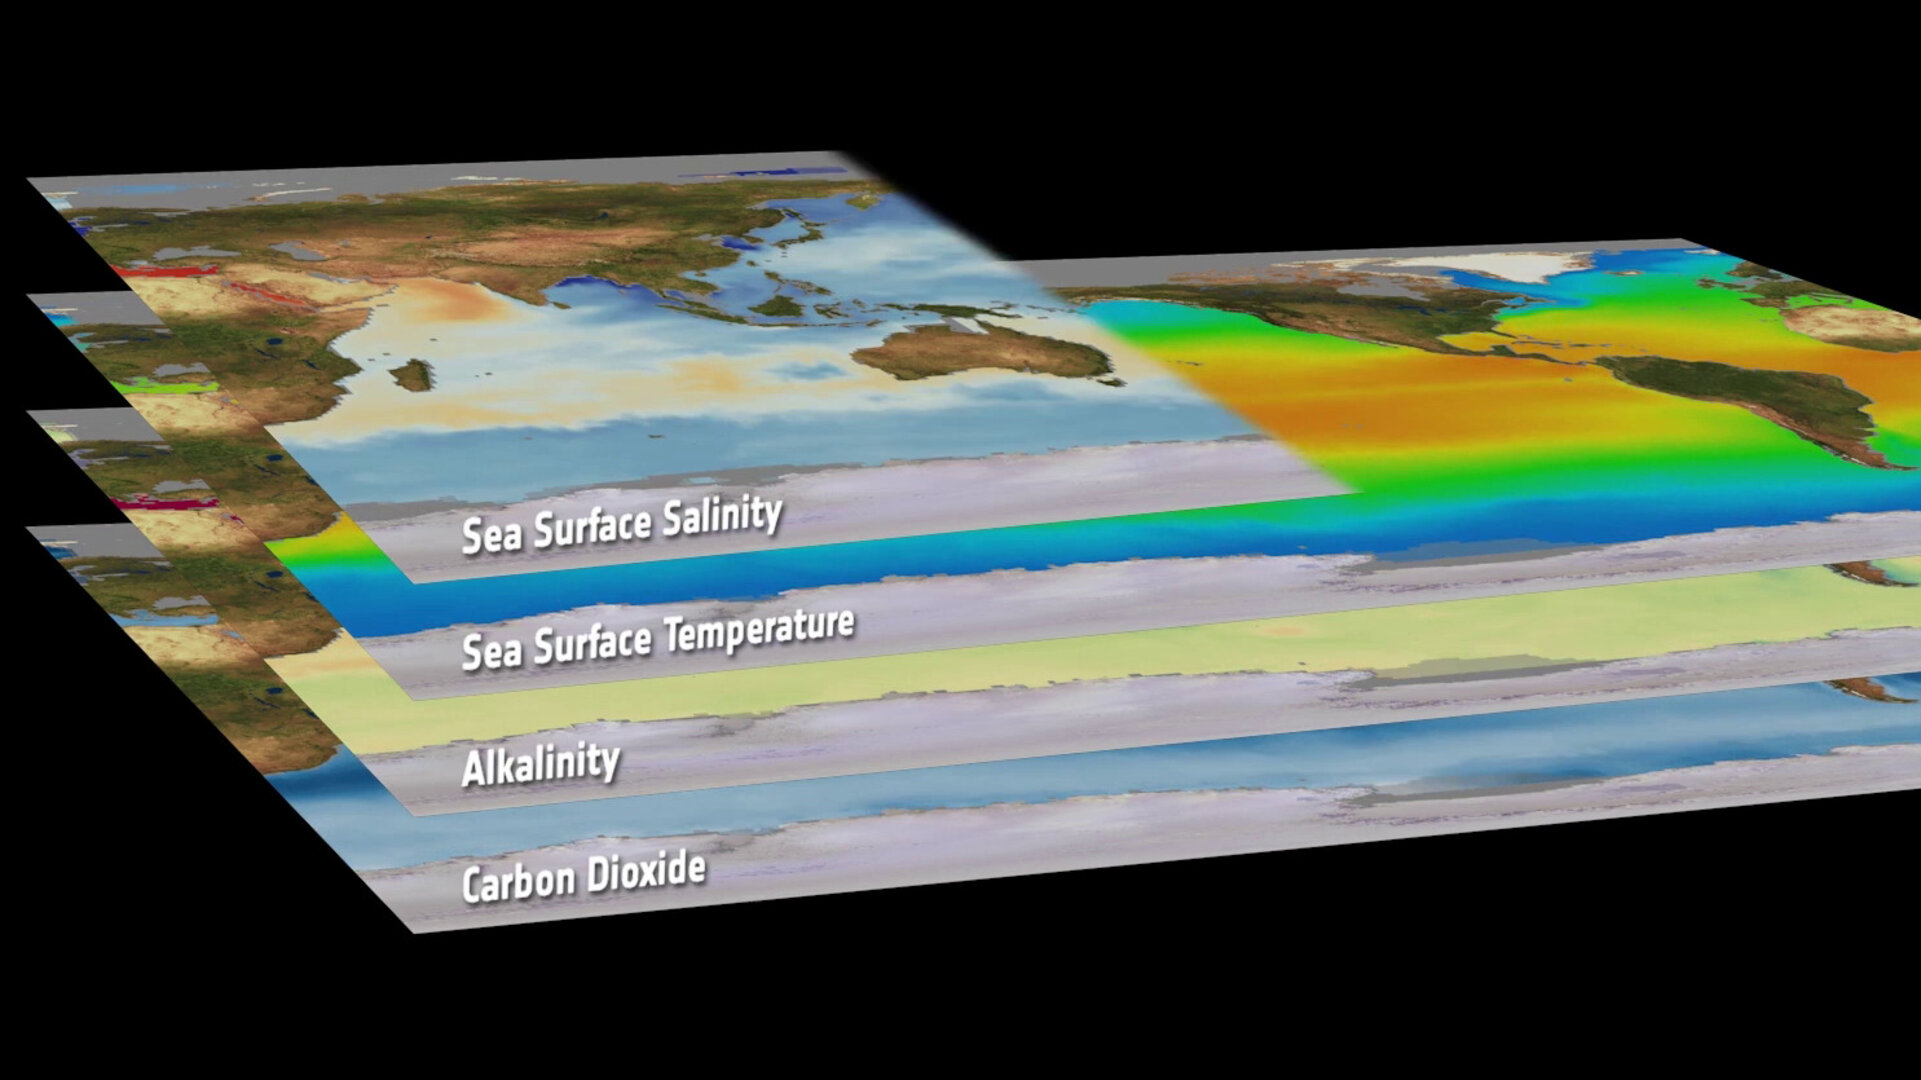
Measurements of seawater pH can be taken from ships, but these are readings are sparse and difficult to use to monitor change. However, variations in marine carbonate chemistry tend to be closely related to variations in temperature, salinity, chlorophyll concentration and other variables, many of which can be measured by satellites that have near-global coverage.

Access the video
A paper published recently in Earth System Science Data describes how scientists working in the OceanSODA project used measurements from ships and from satellites to show how ocean waters have become more acidic over the last three decades.
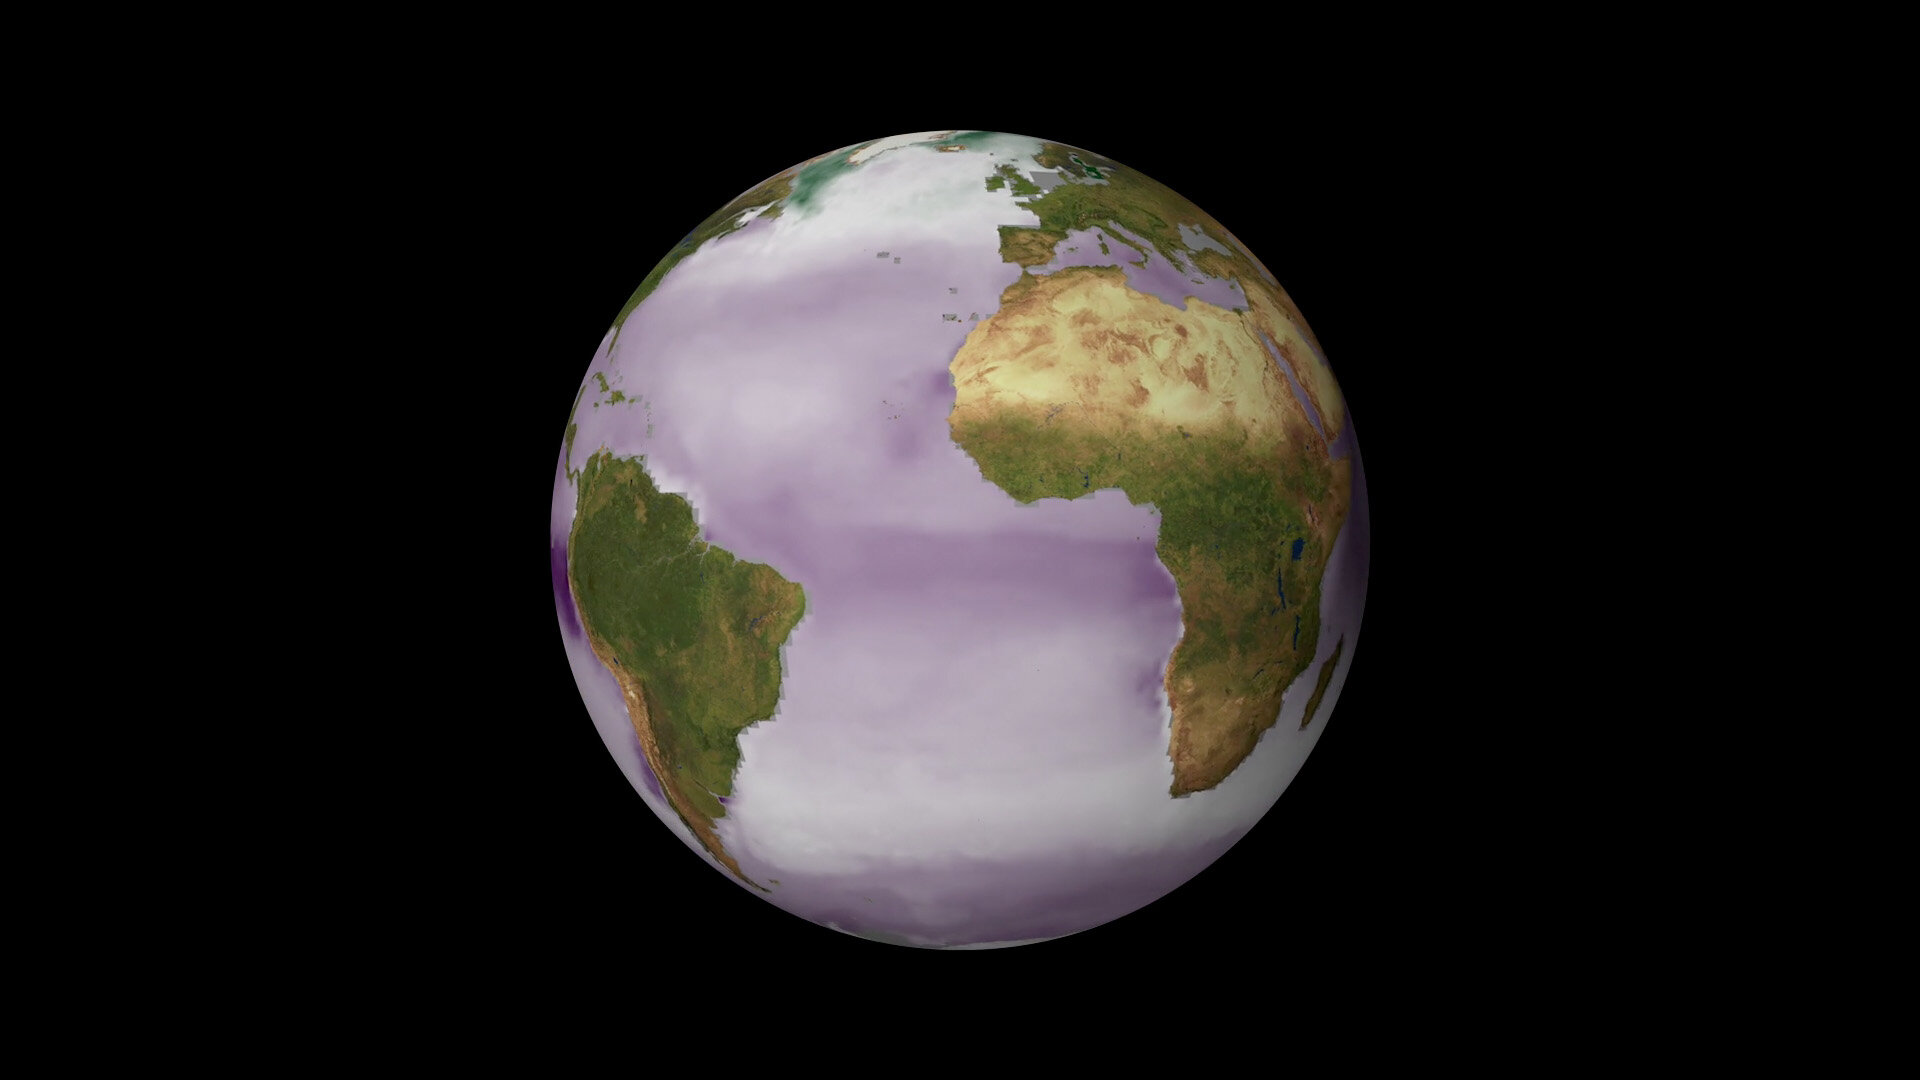
Luke Gregor, from ETH Zurich’s Institute of Biogeochemistry and Pollutant Dynamics and co-author of the paper, explained, “We used both in-situ and satellite measurements of sea-surface temperature, salinity and chlorophyll to derive changes in surface-ocean alkalinity and carbon dioxide concentrations, from which pH and calcium carbonate saturation state and other properties of ocean acidification can be computed.
“To capture the complex relationship between changes in these variables and oceanic carbon, we used the power of machine learning.
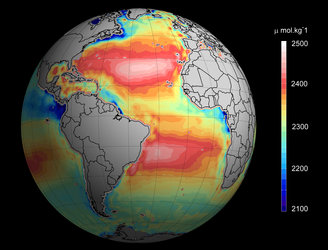
“This provided us with one of the first global-scale observation-based views of the surface-ocean carbonate system from 1985 to 2018. The results show a strong and gradual increase in the acidity of the ocean as it continues to absorb atmospheric carbon dioxide. Along with the increase in the ocean’s acidification, there is an associated decrease in the availability of the carbonate ion concentration, making it harder for organisms to grow their shells and skeletons.”

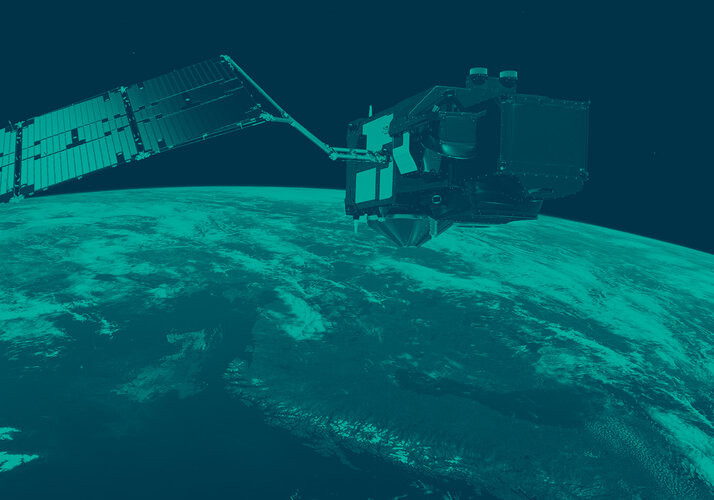
The team used a range of different satellite data, including sea-surface temperature data from the Sea and Land Surface Temperature Radiometer carried on the Copernicus Sentinel-3 satellites and from the Advanced Very High Resolution Radiometer carried on Europe’s MetOp satellites and on the US National Oceanic and Atmospheric Administration’s POES satellites. This dataset came through ESA’s Climate Change Initiative.
Information on chlorophyll was also thanks to a multi-sensor blended dataset through ESA’s GlobColour project and included data from the Ocean and Land Colour Instrument on the Copernicus Sentinel-3 satellites.
Information on ocean salinity was realised through a climate reanalysis dataset called SODA3.
Dr Gregor noted, “Having this wealth of satellite data allows us to really understand what has been happening to our vast oceans over the last 30 years. Moreover, it is essential that we continue to use satellite data to the monitor oceans to further understand the resilience and sensitivity of coral reefs and other marine organisms to the increasing threats of ocean acidification.”
This research was supported by ESA’s Earth Observation Science for Society programme.