Space agencies provide global view of our changing environment
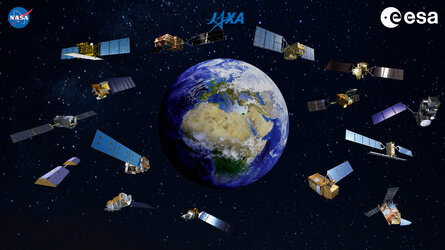
International collaboration among space agencies is central to the success of satellite Earth observation and data analysis. ESA, NASA and JAXA (Japan Aerospace Exploration Agency) have continued their joined effort to develop a storytelling dashboard that combines their resources and expertise to strengthen our global understanding of the changing environment and its economic effects.
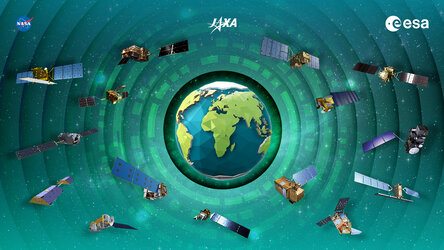
In response to the global COVID-19 pandemic, ESA, NASA and JAXA worked closely together to create an open-source platform, based on the Euro Data Cube, that used a wealth of data from Earth-observing satellites to document the worldwide changes happening to our society and the environment. Now, the COVID-19 Earth Observing Dashboard has been expanded to contain six new focus areas which offers a precise, objective and comprehensive view of our planet.
The dashboard showcases examples of global environmental changes on six new themes: atmosphere, oceans, biomass, cryosphere, agriculture, and the economy. The interactive stories of each theme provide an easy-to-use resource for decision-makers and those not familiar with Earth observation data, with advanced data exploration options available for scientists.
ESA’s Director of Earth Observing Programmes, Simonetta Cheli, commented, “International collaboration between our space agencies is key. Our advanced Earth-observing satellite data provided by ESA, NASA and JAXA are used every day to benefit society at large and advance our knowledge of our home planet.
“After the success of the Earth Observing Dashboard, I am delighted to see how our resources and technical knowledge can be expanded and used to further our understanding of global environmental changes and other societal challenges impacting our planet.”
"At NASA, accessibility to data is a top priority,” said Karen St. Germain, NASA Earth Science Division Director. “With our partners at ESA and JAXA, this is another important step to getting the latest information to the public about our changing planet, in an accessible and convenient way, which can inform decisions and planning for communities around the world.”
Koji Terada, Vice President and Director General of Space Technology Directorate at JAXA, added, “Following the collaboration with NASA and ESA on COVID-19, we expanded this dashboard to widely provide the stories on global issues such as environmental and climate change to the world in the trilateral collaboration. From the perspective of contributing to the understanding of Earth's environment and systems and enhancing the values of Earth observation data, we, JAXA will continue to work on updating this dashboard.”
Utilising accurate remote sensing observations, the dashboard shows the changes occurring in Earth’s air, land, and water and their effects on human activities. Users can explore countries and regions around the world to see how the indicators in specific locations change over time, and deep dive into data-driven stories and interactively explore datasets.
The atmosphere focus area demonstrates ways in which air pollution and climate change contribute to the biggest environmental challenges of our time, while the biomass focus area features a story describing how trees and plants remove substantial amounts of carbon dioxide out of the atmosphere each year.
The agricultural area allows users to explore satellite data that provides insights into agricultural production, crop conditions and food supply. The cryosphere features a story on the effects of global temperature rise on the extent of sea ice.
The water and ocean area focuses on the Earth’s largest natural resource and enables users to discover a view of the ocean that is as rich and complex as that of land. The economy focus area provides access to datasets that show how the Earth's social and economic systems are connected to the environment.
In addition, the Earth Observing Dashboard also provides direct access to a dataset exploration tool. Using the dataset explorer, users can examine any of 72 economic indicators, 35 agriculture indicators, 29 air quality indicators, 37 water indicators, and two health indicators. It also contains tutorial links that demonstrate how to make use of the dataset exploration tool through real-world examples.
ESA, JAXA, and NASA will continue to enhance this dashboard as new data becomes available. The dashboard can be accessed here.