
How does Gaia study the Milky Way?
Gaia mapped the galactic neighbourhood of the Sun in three dimensions by measuring positions in the sky, distances from Earth, and velocities of more than one billion stars. The Gaia data enable researchers to not only unravel the structure of the Milky Way in unprecedented detail but also to model the galaxy’s behaviour hundreds of millions of years into the past as well as into the future. But how exactly did Gaia do that?
Here are the key astronomical concepts that allowed Gaia to create its unprecedented 3D map of our home galaxy.
Parallax
Distances in the Universe are unimaginably vast: even the nearest star (after the Sun) is 40 trillion kilometres away from Earth. This is way too far to send a spacecraft and measure the distance directly as one goes, but astronomers use a mathematical trick, called parallax, to calculate such faraway distances.
You can discover the concept of parallax right now by holding your finger out in front of your face and closing one eye. Look at where your finger is in relation to objects in the background. Now open the other eye, and close the first. Your finger appears to move against the more distant objects, even though you haven’t moved it and you haven’t moved yourself. This is parallax: the direction of nearby objects compared to background objects changes when you observe them from different points (your left and right eye are separated by some 6 cm).
You can experiment further by moving your finger to different distances in front of your face and blinking from eye to eye. You will see that your finger appears to move a greater distance when it is closer to your face than when it is further away.
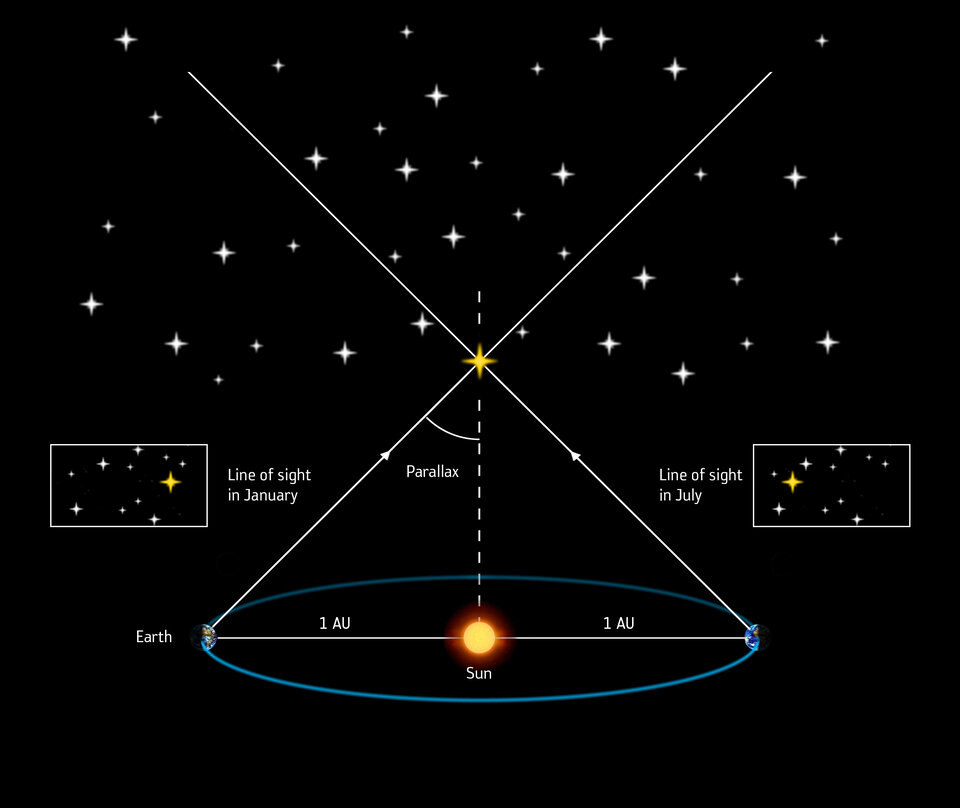
Gaia used the same concept for observing distances to stars. In this case, however, the 6 cm that separate the human eyes are expanded to some 300 million kilometres, corresponding to Earth and Gaia being on either side of the Sun during the planet’s yearly revolution around it. In this case, nearby stars appear to move against the backdrop of more distant stars.
By measuring the amount of displacement – the parallax angle – and knowing the distance between the Sun and Earth (and Gaia), astronomers can determine the star’s distance using simple trigonometry.
Even for the nearest stars, the amount of apparent movement is tiny: less than one arcsecond. Yet, Gaia measured the distances of nearly two billion stars to micro-arcsecond accuracies. (An arcsecond is 1/3600 of a degree, and one degree is about twice the size of the full Moon in the sky.)
Proper motion

Access the video
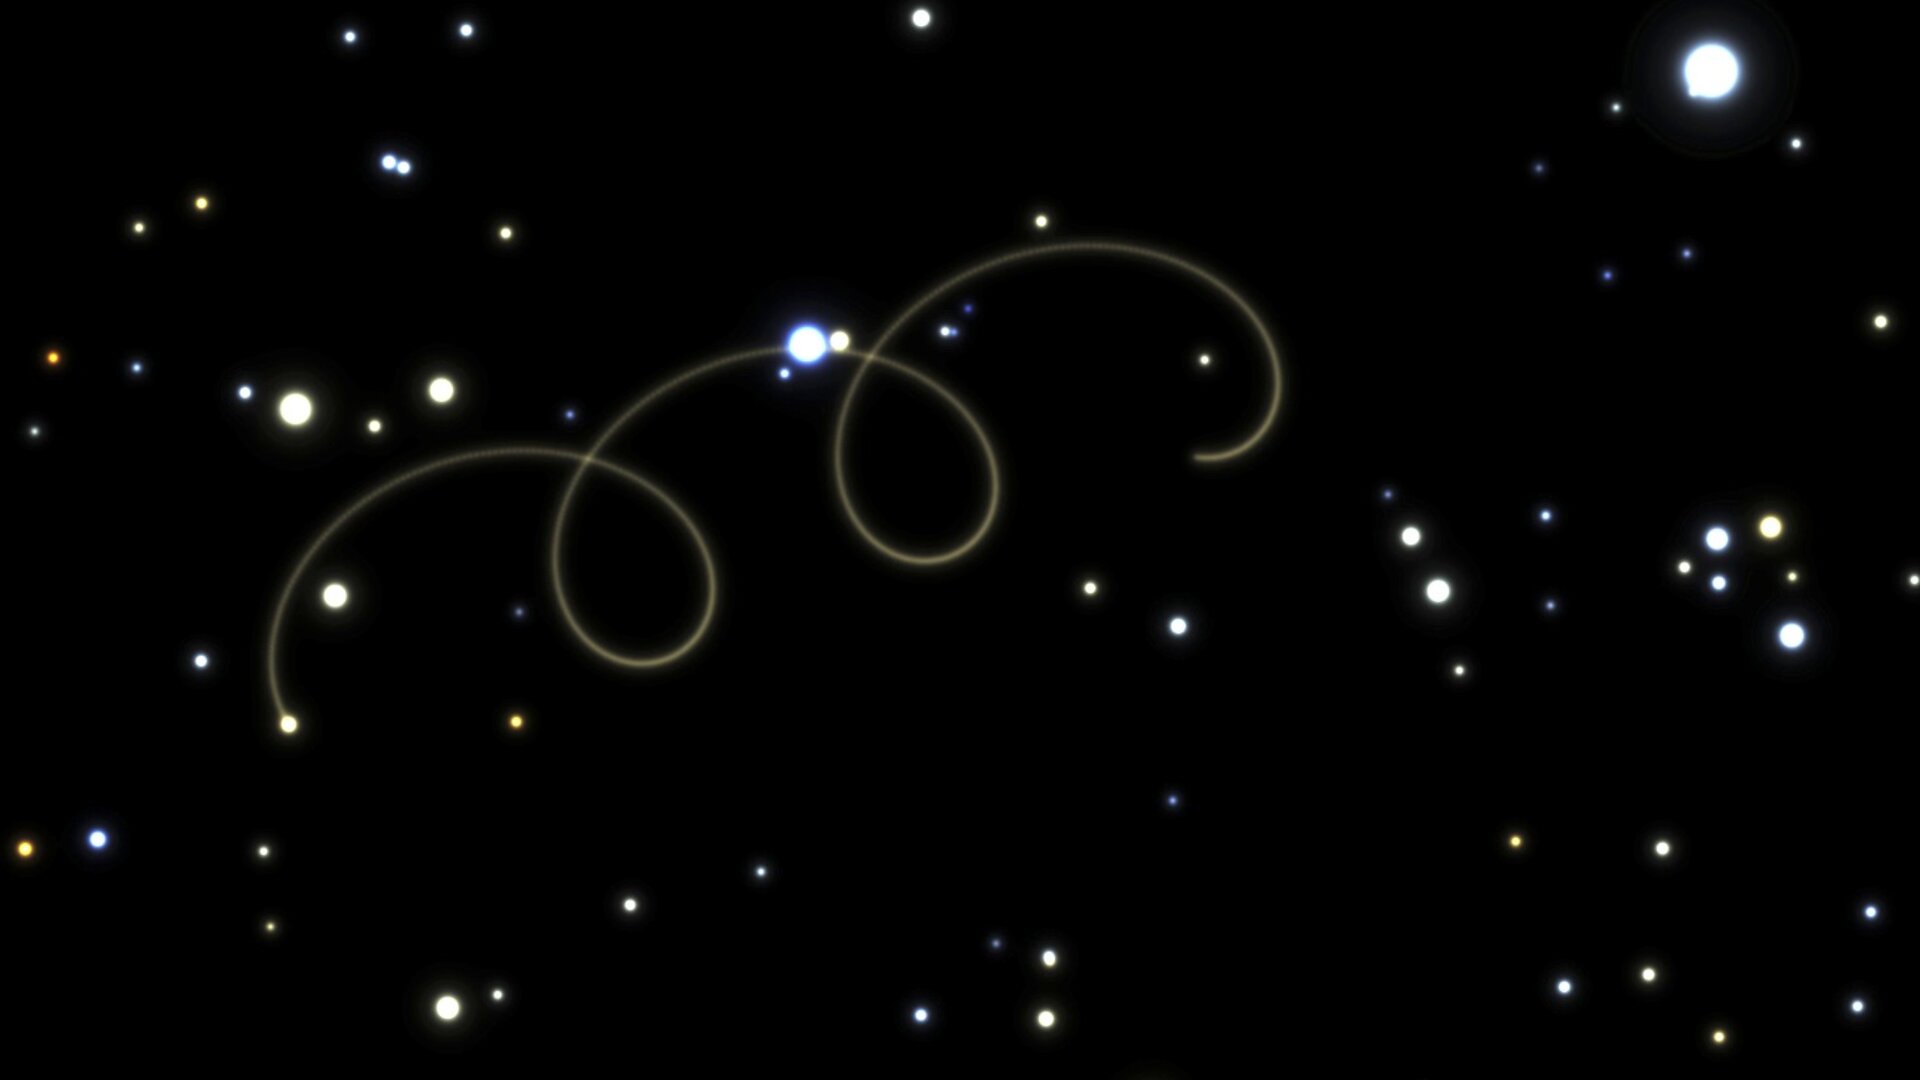
The proper motion of a star is the actual change of its position in the sky over time that is not related to the (apparent) annual parallax motion, which is caused by the orbit of Earth and Gaia around the Sun. When Gaia measured the distances to stars, it observes the combined effect of parallax motion and proper motion. Since parallax motion repeats every year, while proper motion is a continuous, linear effect, a few years of observational monitoring allowed the Gaia scientists to separate the two effects for every star.
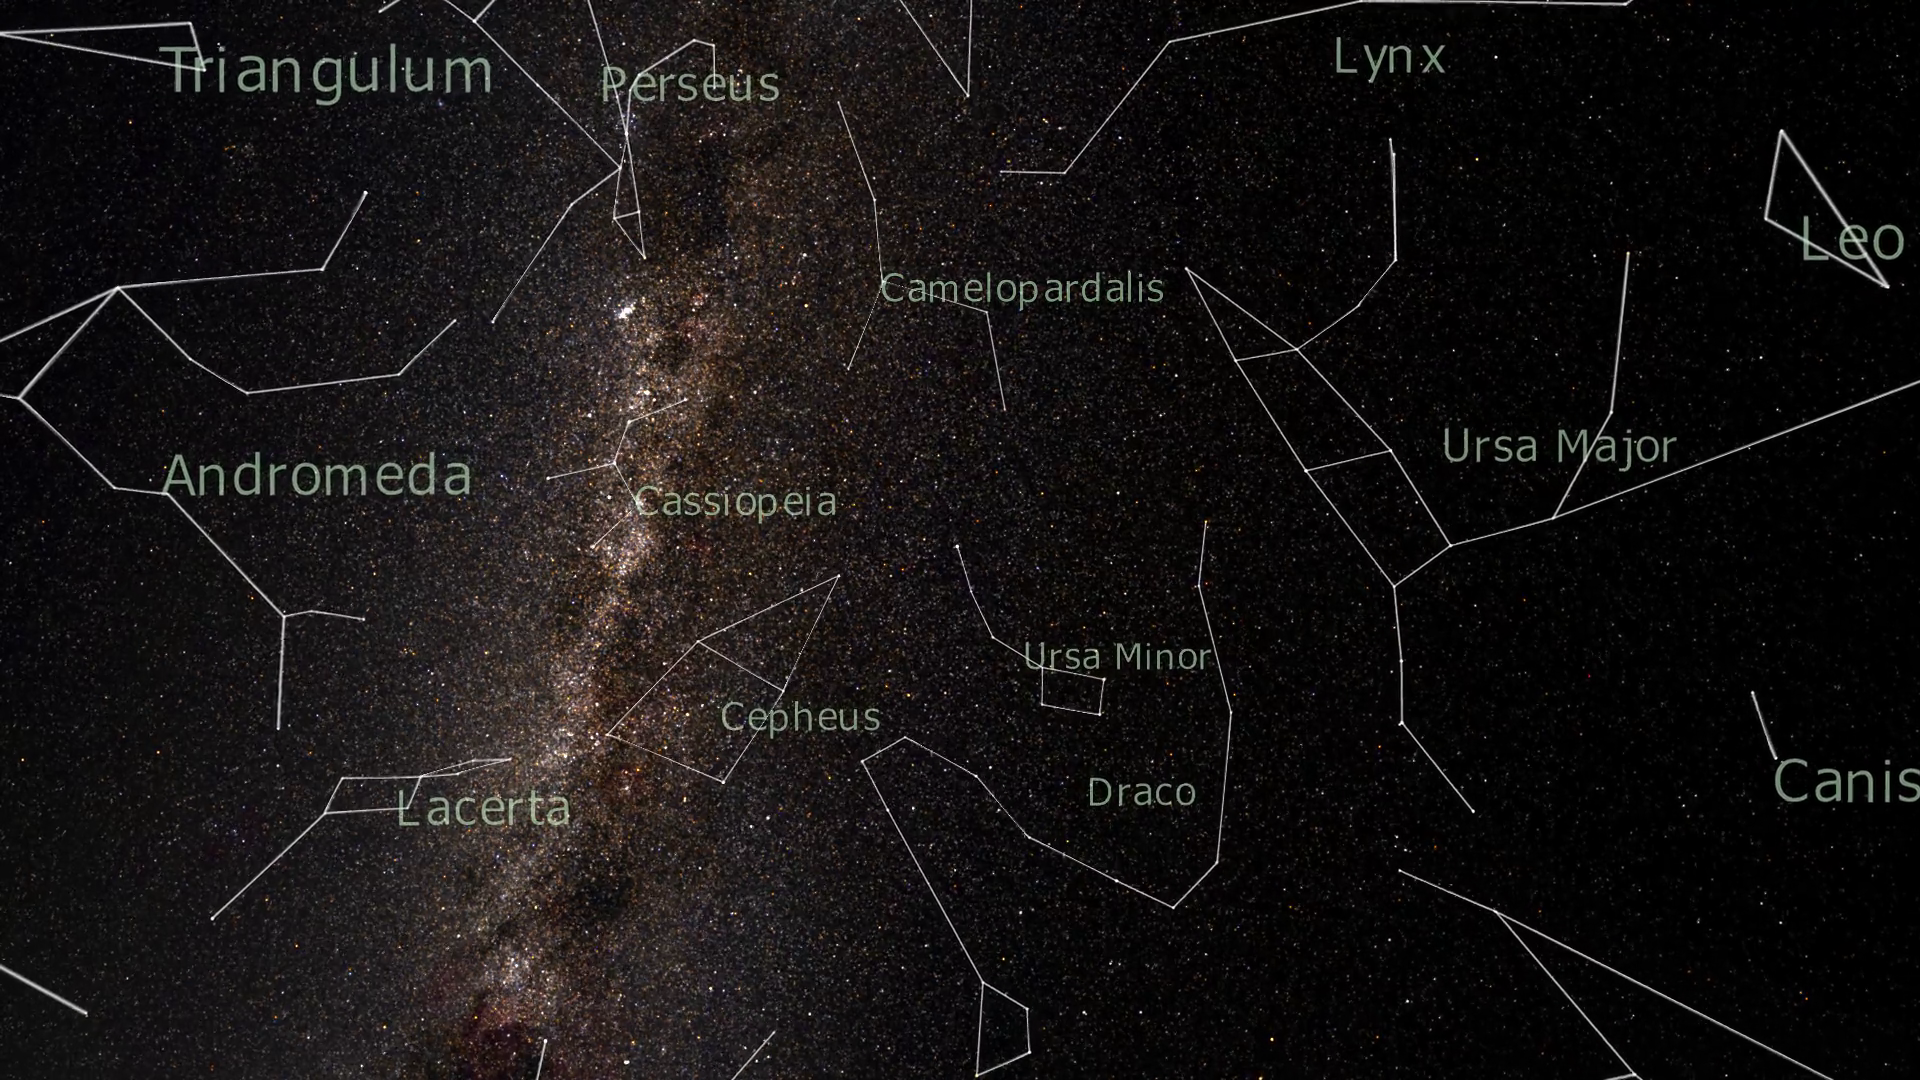
Although the constellations appear fixed, over millennia, the different proper motions of the individual stars will cause them to change. This is not something you can see with your own eyes over your lifetime, but it is rather like the geological process of plate tectonics that has changed the shape of the continents over billions of years.
Edmund Halley first noticed proper motions in 1718, when he found that the positions of several bright stars were slightly different to those observed by the ancient Greek astronomer Hipparchus some 2000 years previously. Like for parallax, nearby stars have large proper motions while distant objects have small proper motions. To convert proper motions on the sky, which are measured in arcseconds per year, to velocities in space (for instance in units of kilometres per second), astronomers need to know the distance to the stars.
The star with the largest known proper motion is called Barnard’s Star. It moves on the sky at a speed of 10.3 arcseconds per year, which is the equivalent of it moving across the face of the Moon in 180 years. All other stars have (much) smaller proper motions.
By combining the proper motions with radial velocities (see below) and distances measured by Gaia, astronomers are able to determine the star’s true, 3D motion through space.
Radial Velocity
Access the video
The radial velocity of a star is the speed towards or away from the observer, or in this case, towards or away from Gaia. (In practice, the Gaia scientists correct Gaia’s radial velocity measurements for the motion of Gaia with respect to the Sun to deliver radial velocities with respect to the Sun.)
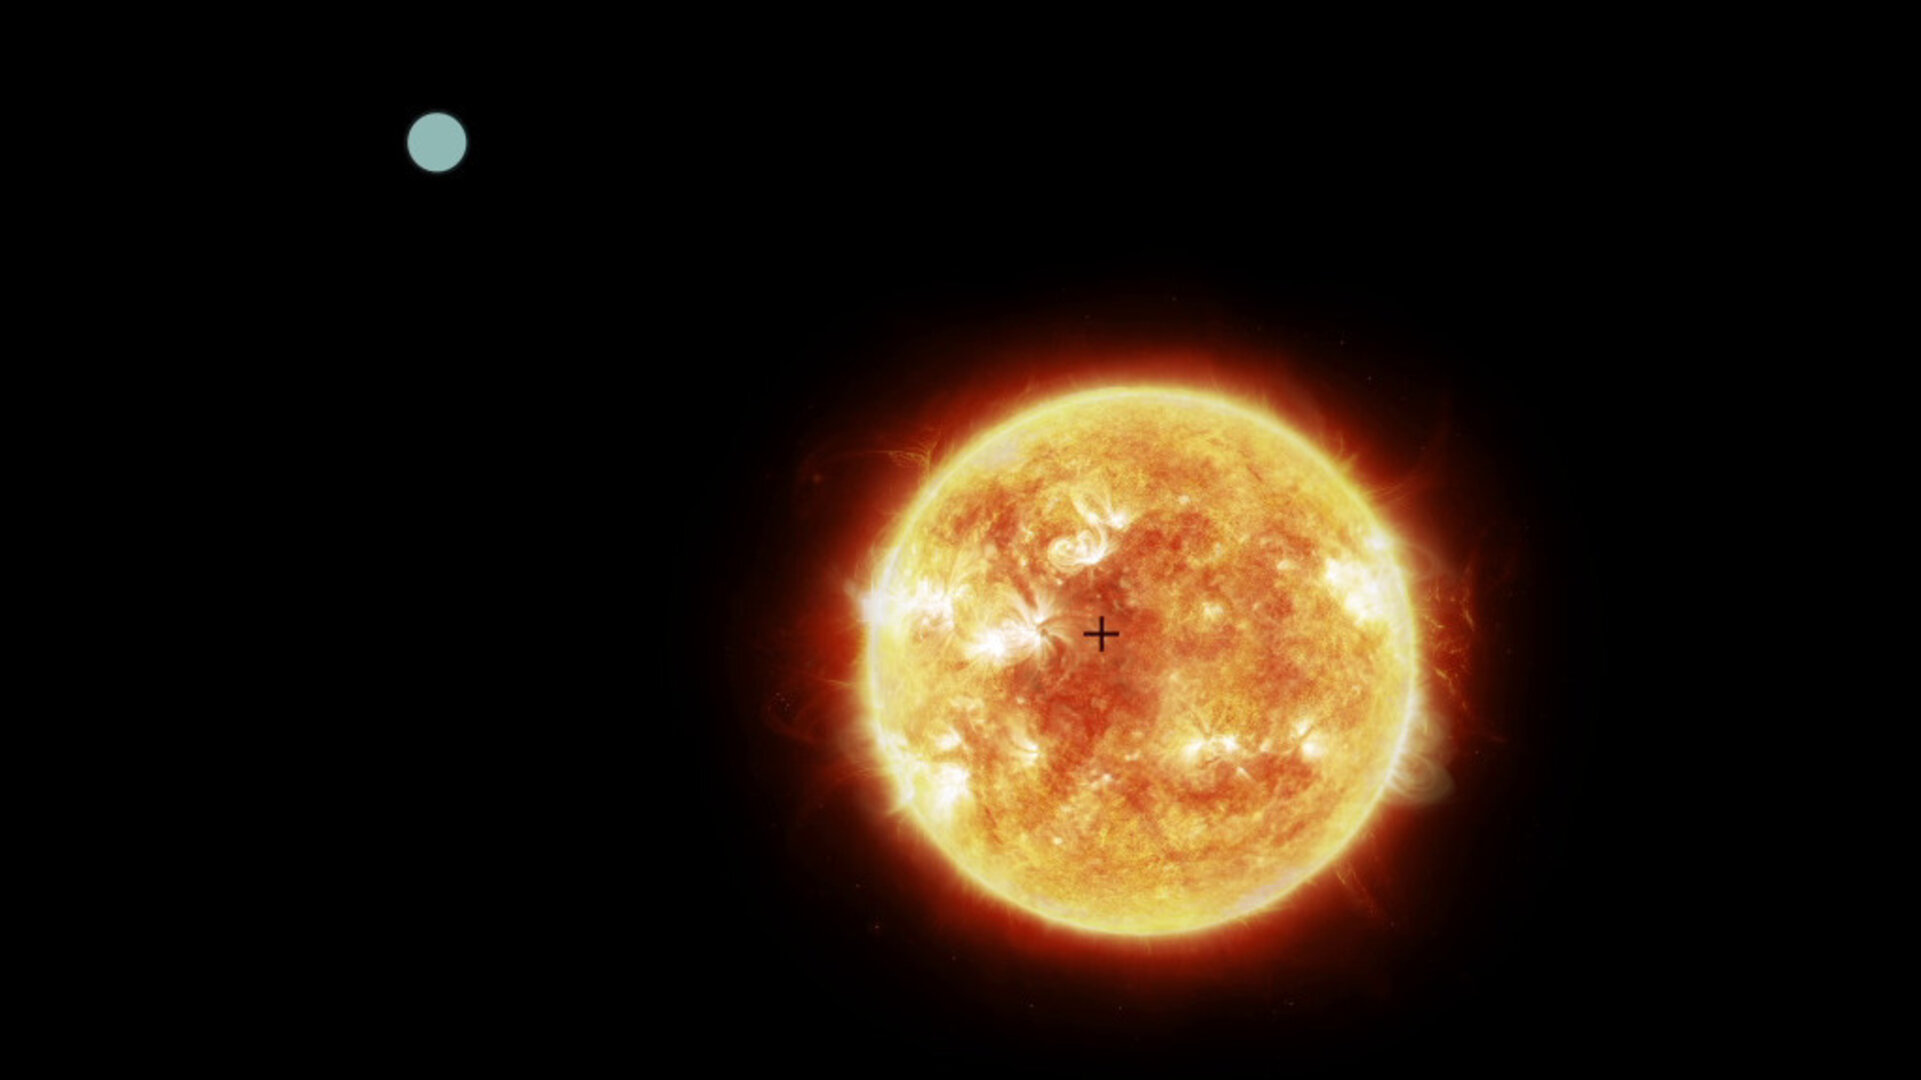
Gaia determined the radial velocity of its stellar targets by analysing the Doppler effect in the colour of the light that the stars emit. Similar to the changing frequency of a siren on a passing ambulance car, the colour frequency of light moving away from an observer decreases (colours become redder, redshift), while the frequency of light moving towards an observer increases (colours become bluer, blueshift)
The radial velocity of stars can be accurately determined by measuring the colour shift of spectral lines in high-resolution spectra of stars. Spectral lines move towards the red end of the spectrum as the star moves away from Gaia, while a star moving towards Gaia will have its frequency of light compressed, shifting the spectral lines to the blue end of the spectrum.
In addition to proper motion, stellar radial velocities are needed to determine the actual 3D velocity of stars with respect to the Sun, and are therefore essential to our understanding of the kinematics of our galaxy.
Spectroscopy
Many of Gaia’s measurements are based on light spectra of the stars, which the spacecraft collected. Stellar spectra indicate how bright the star shines at different colours of light. Like a unique fingerprint, they contain detailed information about the star’s composition, temperature, and motion. Spectra can also reveal whether a star has any (faint) companions, including orbiting planets.
Obtaining spectra requires the light from a star to be passed through a prism and split into a spectrum, rather like water droplets in the atmosphere splitting sunlight into a rainbow.
When the spectrum is magnified, narrow dips can be seen superimposed on the continuous palette of rainbow colours. These so-called spectral lines correspond to the wavelengths (colours) of light that have been absorbed by chemicals on the surface of the star from which the light originated.
Every element and molecule generates its own chemical fingerprint through a series of unique spectral lines at different wavelengths (colours). The strength and width of the dips in the spectra provide an indication of the amount (abundance) of each element that is present in the star and under what temperature and pressure conditions each element exists.
Photometry

Very simply, photometry is the science of measuring light, in particular its brightness and colour. In the Gaia universe, this meant measuring the intensity of light emitted by stars in various colours, from which their temperature, mass, age and composition can be derived. But to estimate a star’s true brightness, its distance is needed – calculated from the parallax measurements.
The data derived from photometric observations enable Gaia scientists to classify stars into ‘families’ and map the overall chemical evolution of the galaxy. The information is plotted on a so-called ‘Hertzsprung-Russell diagram’. Stars are plotted according to their colour and brightness and are grouped in different regions of the diagram depending on their masses, ages, and stages in the stellar life cycle.
In the diagram seen above more than four million stars within five thousand light-years from the Sun are plotted using information about their brightness, colour and distance from Gaia’s second data release. Gaia has revealed features in this diagram that were not previously known, especially in the white dwarf region of the diagram, which has allowed astronomers to see the signature of different types of white dwarfs and how matter inside white dwarfs behaves.
Though Gaia itself has now gone silent, its contributions to astronomy will continue to shape research for decades. Its vast and expanding data archive remains a treasure trove for scientists, refining knowledge of galactic archaeology, stellar evolution, exoplanets and much more.