What do the colours mean?
How do you display a picture of Mars taken with an electronic eye, capable of seeing wavelengths of light that are invisible to humans? Welcome to the wonderful world of ‘false’ colour…
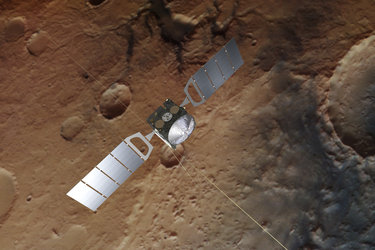
The first trio of images from the OMEGA instrument on ESA's Mars Express, released on 23 January 2004, showed some colourful views of Mars’ south polar ice cap. That is mainly because two of the images were taken at infrared wavelengths that defy easy translation into colour. So, they were displayed in ‘false’ colour.
William Smith, the British ‘father’ of geology, introduced false colour to science in the 1800s. He wanted to draw a map of Great Britain to show the different types of rock that could be found across its surface and decided to colour code the rocks.
The colours were not intended to represent the true colours of the rocks, but simply to act as a key to identifying them. Political maps of the world also use of false colour, clearly showing the boundaries between countries because of the sudden change of colour.

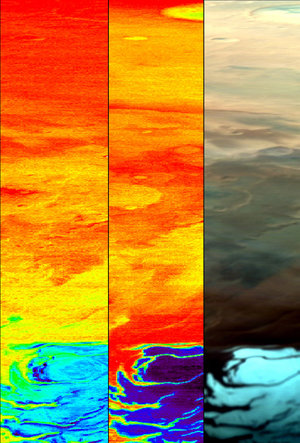
The OMEGA images here show a visible light image of the Martian south pole (far right). This is a traditional combination of red, blue and green wavelengths that all computers and televisions use to make full-colour images.
The other two images, the middle one showing the distribution of carbon dioxide ice and the left-hand image showing the distribution of water ice are falsely coloured.
Both ice images are made from infrared radiation reflected by the surface of Mars. Because carbon dioxide and water absorb and reflect characteristically different wavelengths of infrared, OMEGA can identify each chemical compound by looking at the missing parts of the spectra received back from the surface.
The astronomers then used false colour to show how much ice had been detected at the polar cap. The colour scale is blue to red. The bluer the area, the more carbon dioxide ice in the middle image and, in the left-hand image, the more water ice. Red areas are deficient and yellow areas are intermediate zones.
Comparing the pictures, the wide yellow expanse on the left-hand image shows that the water ice is more widespread than the carbon dioxide ice. The carbon dioxide ice collects mostly in the blue peak of the middle image.
With this early success, OMEGA’s Principal Investigator Dr Jean-Pierre Bibring, Institut d’Astrophysique Spatiale, France, is looking forward to the rest of mission. He says, “Our goal now is to map the whole planet.”
So, as William Smith’s 1815 map of Great Britain helped show the mineral wealth of England, Wales and Scotland, so OMEGA will eventually show the distribution of minerals and rock types across the surface of Mars. Like its predecessor, it too will be presented in glorious ‘false’ colour.