Ice sheet highs, lows and loss
Measurements from ESA’s CryoSat mission have been used to map the height of the huge ice sheets that blanket Greenland and Antarctica and show how they are changing. New results reveal combined ice volume loss at an unprecedented rate of 500 cubic kilometres a year.
The research was carried out by Germany’s Alfred Wegener Institute Helmholtz Centre for Polar and Marine Research and the results were published today in The Cryosphere, a European Geosciences Union journal.
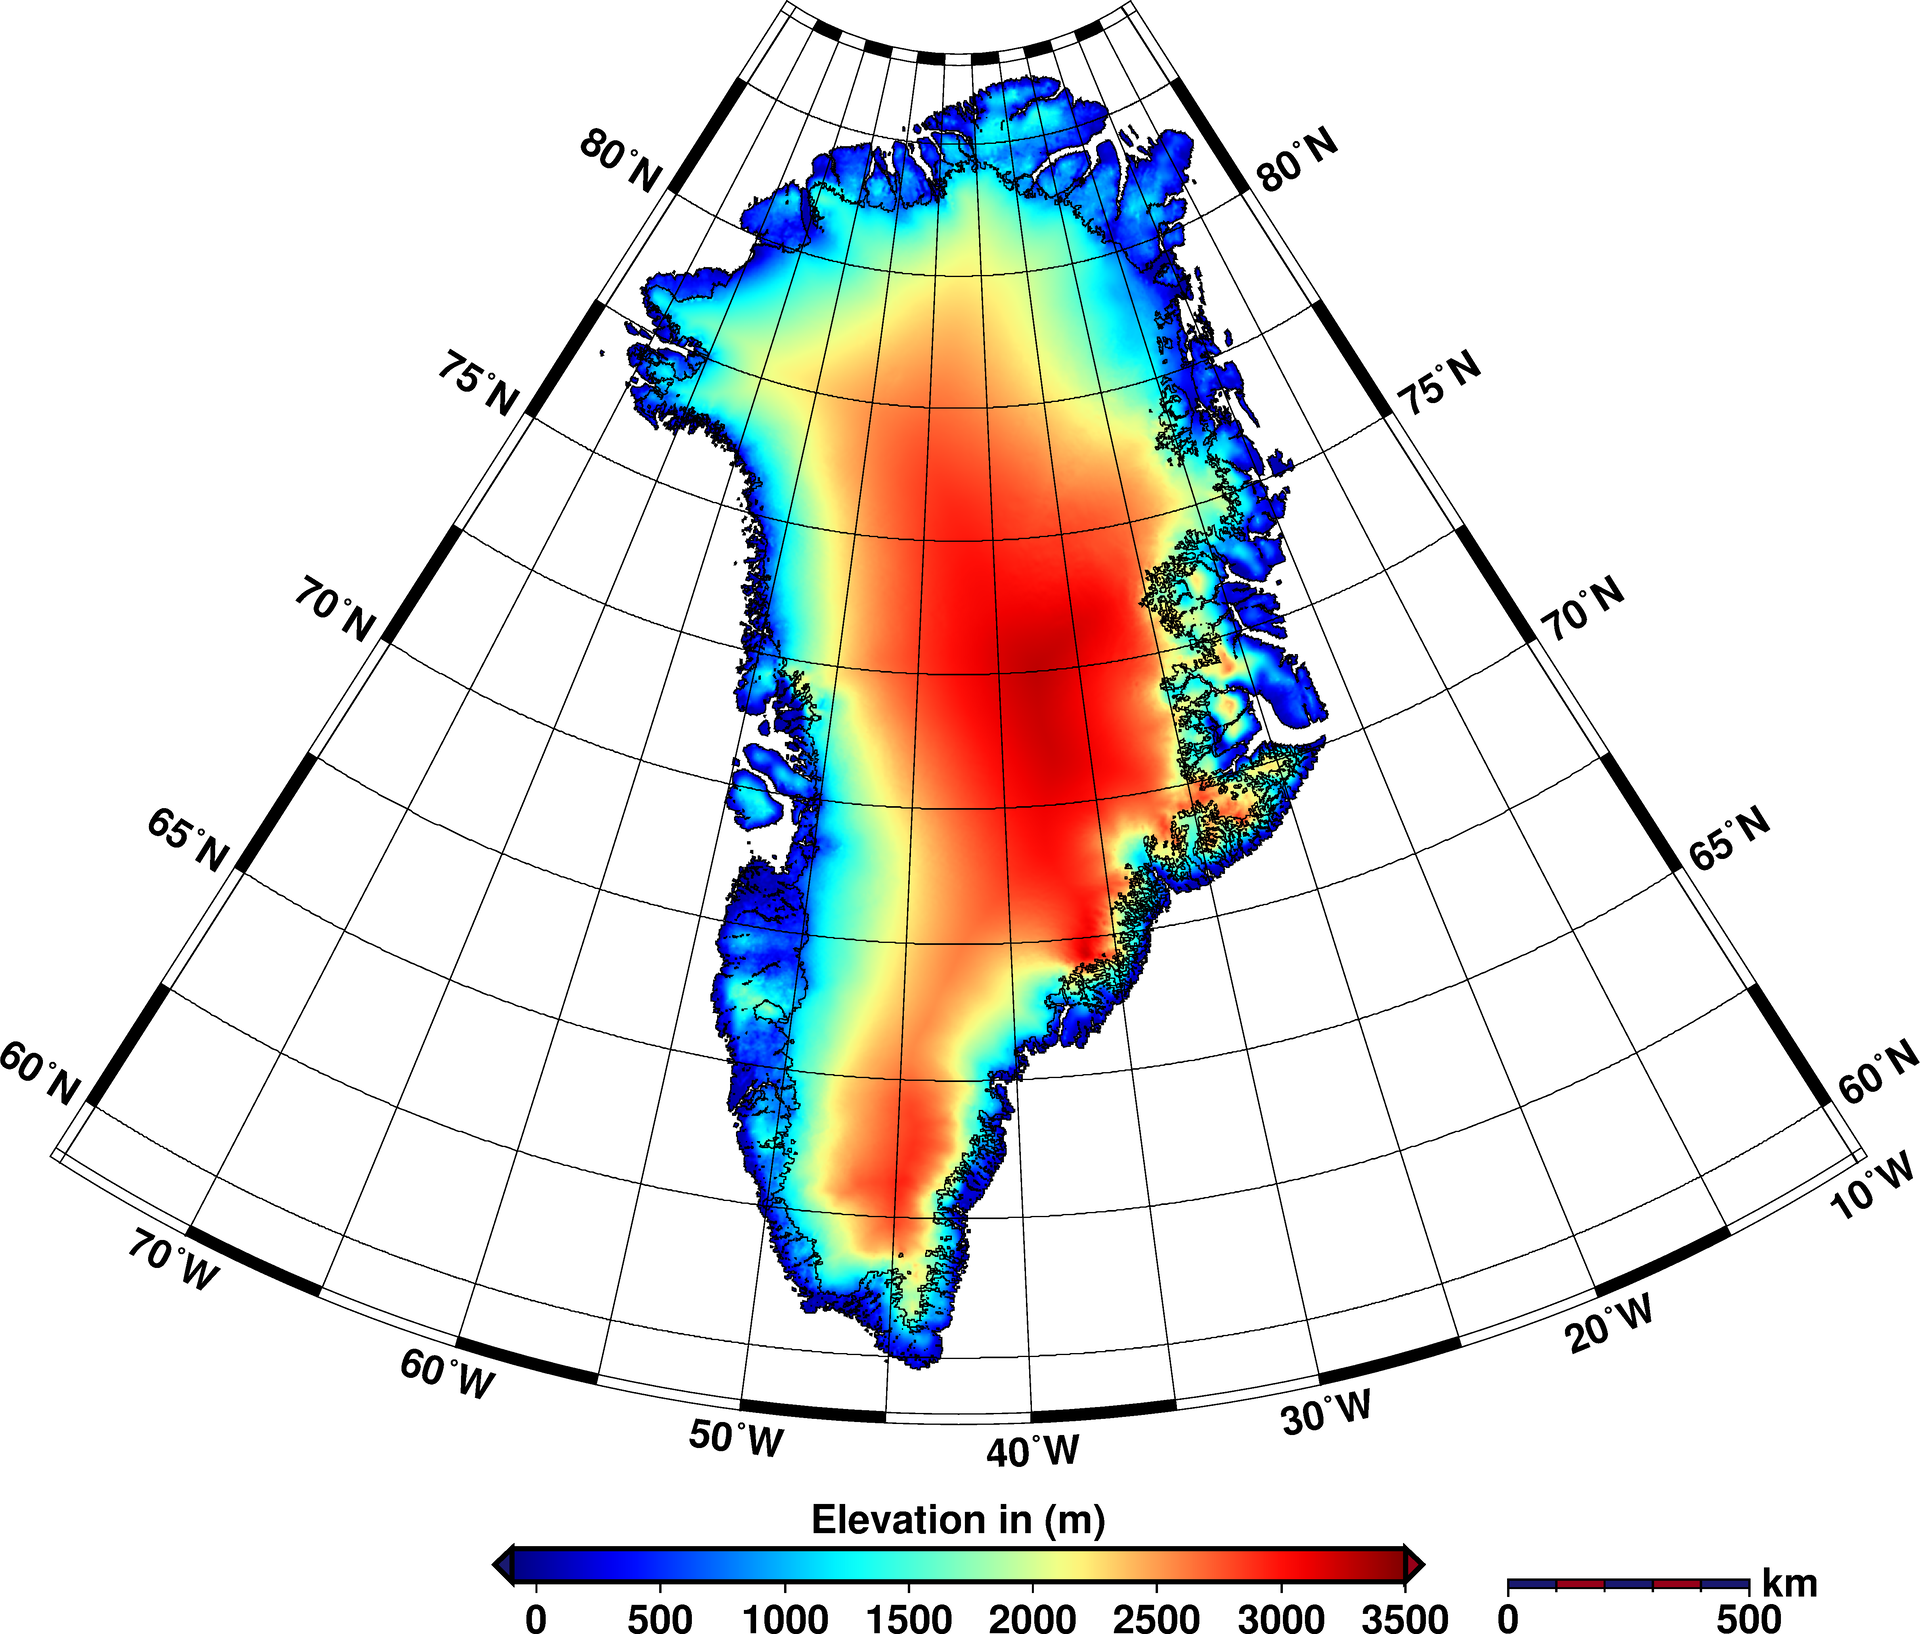
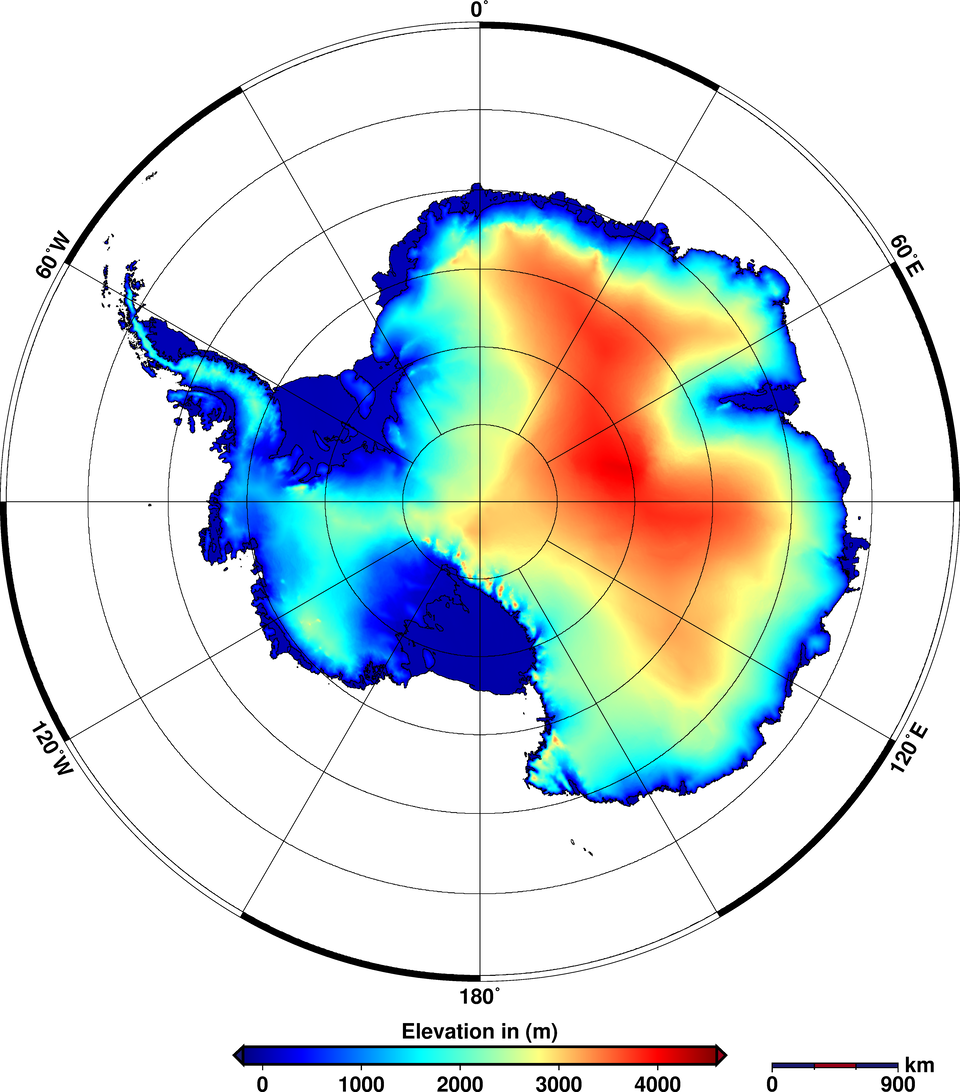
The new maps, which incorporate 7.5 million elevation measurements of Greenland and 61 million of Antarctica collected by CryoSat in 2012, are the most complete to date from a single satellite mission.
Lead author Veit Helm said, “The new elevation maps are snapshots of the current state of the ice sheets. They are very accurate and cover close to 16 million sq. km, which is 500 000 sq. km more – about the size of Spain – than previous elevation models from altimetry.”
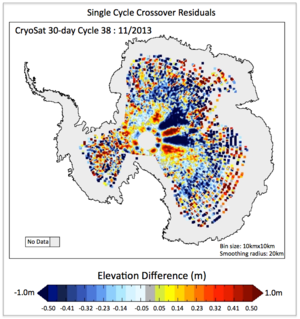
Reaching latitudes of 88°, CryoSat orbits closer to the poles than earlier missions. It carries SIRAL – a precise radar altimeter that sends out short radar pulses that bounce off the ice surface and back to the satellite. Measuring the time this takes yields the height of the ice.
In fact, SIRAL is the first radar altimeter of its kind to overcome the difficulties intrinsic to measuring icy surfaces. The instrument allows scientists to determine the thickness of ice floating in the oceans and to monitor changes in the vast ice sheets on land, particularly around the edges where icebergs are calved.
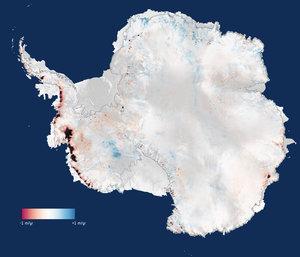
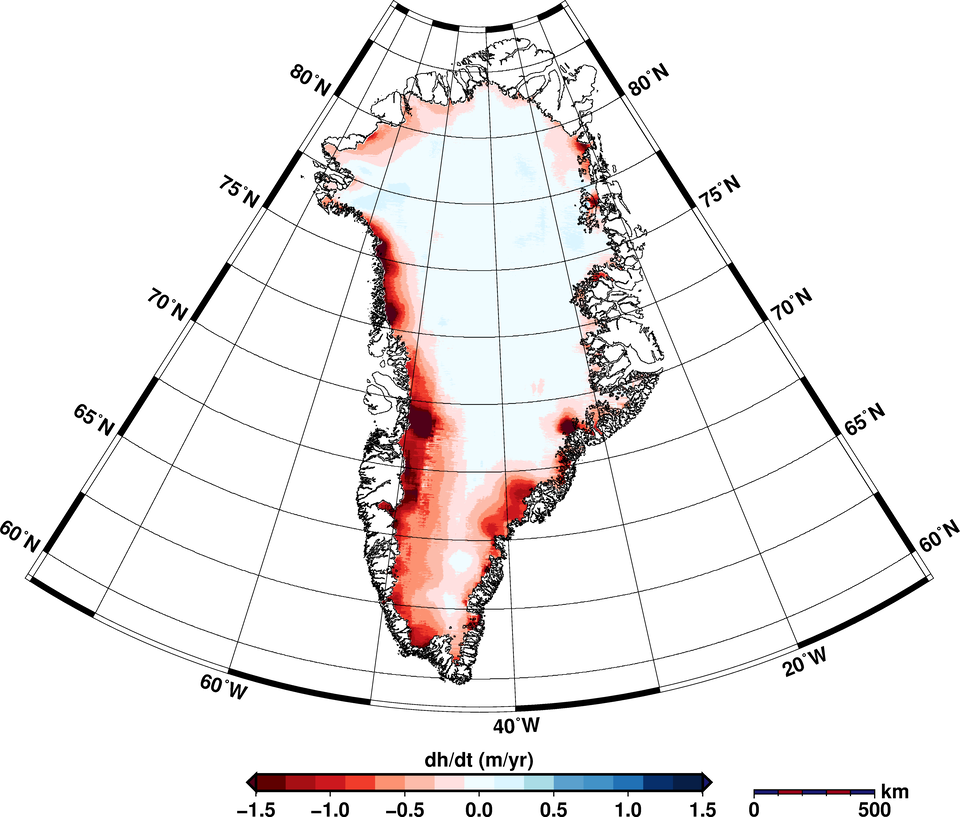
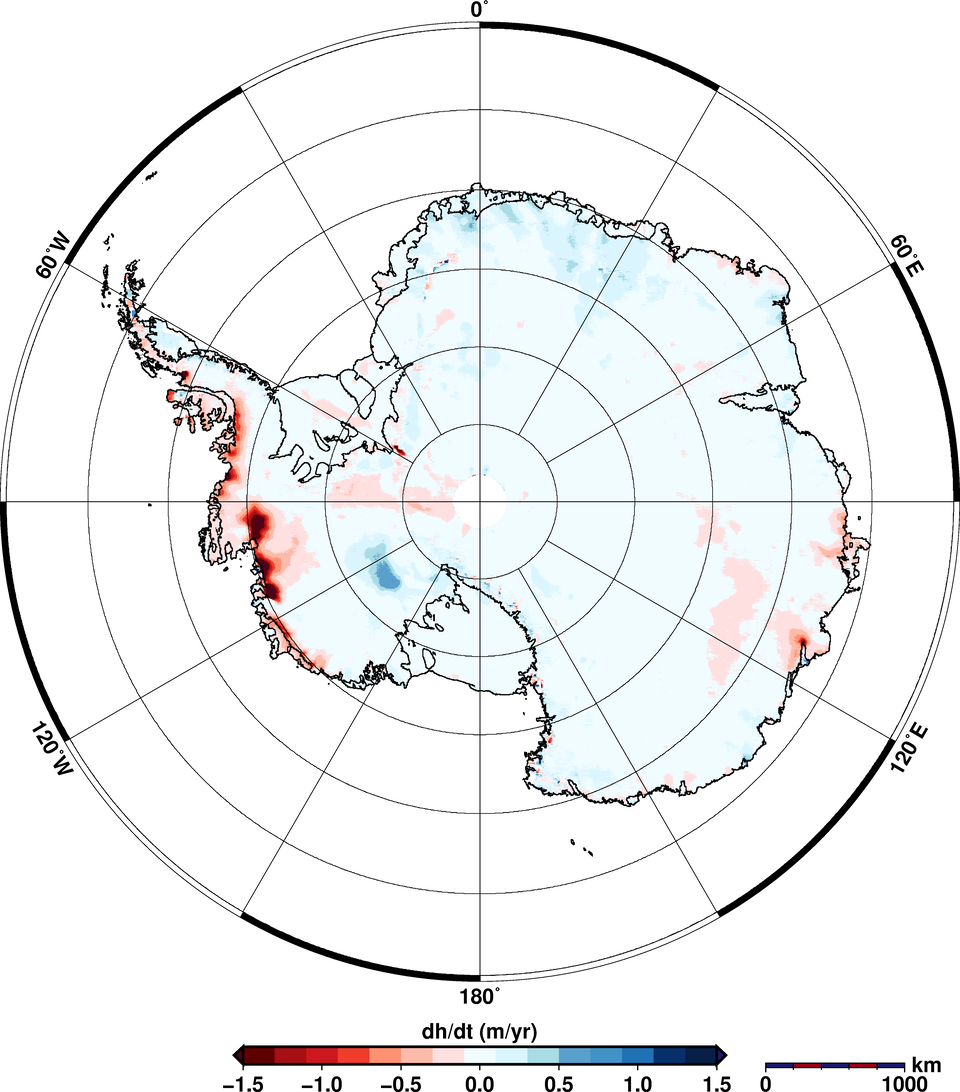
In addition to showing the current highs and lows of the ice sheets, the study also highlights how much ice was lost between January 2011 and January 2014. Ice sheets gain mass through snowfall and lose it through melting and by glaciers that carry ice from the interior to the ocean.
It is important to assess how ice-sheet surface elevation and thickness across Greenland and Antarctica is changing to understand how they are contributing to sea-level rise.
Using an astonishing 200 million data points across Antarctica and 14.3 million across Greenland collected by CryoSat, the team were able to study how the ice sheets changed over the three years.
The resulting maps reveal that Greenland alone is reducing in volume by about 375 cubic kilometres a year.
The two ice sheets combined are thinning at a rate of 500 cubic kilometres a year, the highest rate observed since altimetry satellite records began about 20 years ago.
The researchers say the ice sheets’ annual contribution to sea-level rise has doubled since 2009.
Glaciologist Angelika Humbert, another of the study’s authors, added, “Since 2009, the volume loss in Greenland has increased by a factor of about two and the West Antarctic Ice Sheet by a factor of three.
Both the West Antarctic Ice Sheet and the Antarctic Peninsula, in the far west, are rapidly losing volume. By contrast, East Antarctica is gaining volume, though at a moderate rate that doesn’t compensate for the losses on the other side of the continent.”
The researchers detected the biggest elevation changes in Jakobshavn Glacier in Greenland, which was recently found to be shifting ice into the oceans faster than any other ice-sheet glacier, and Pine Island Glacier, which like other glaciers in the West Antarctica, has been thinning rapidly in recent years.
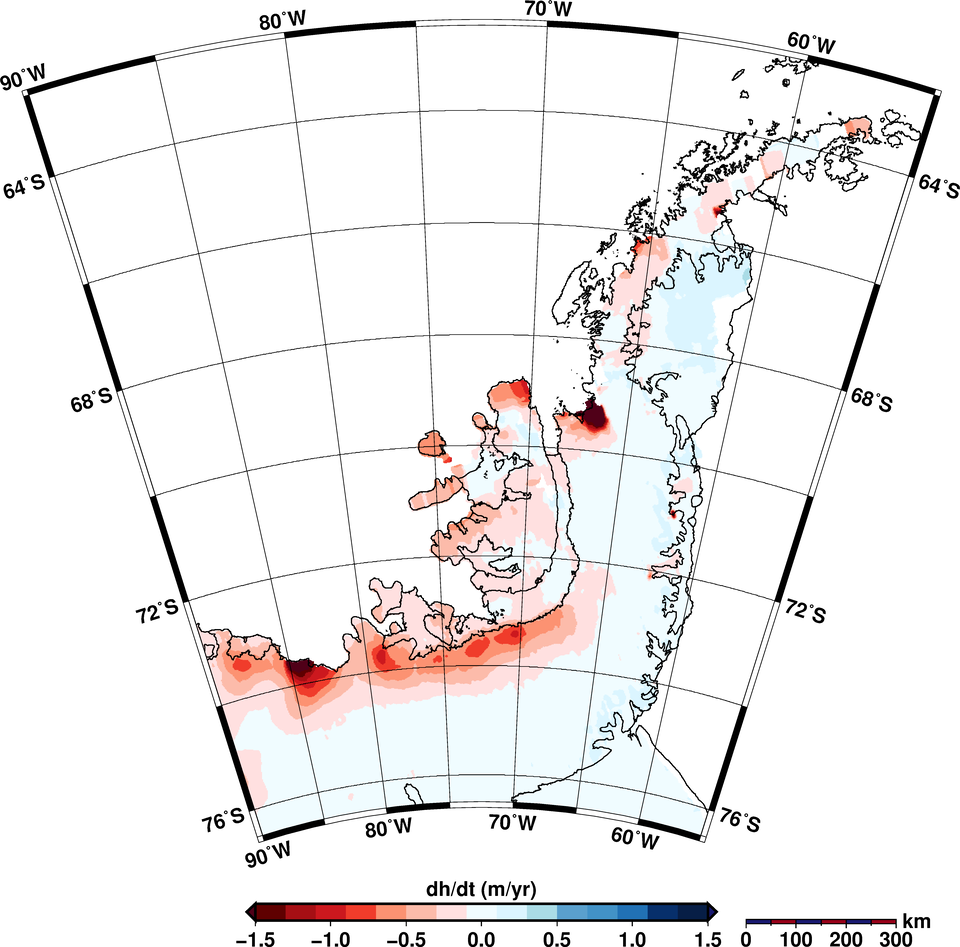
The study highlights how important CryoSat is for producing height maps, particularly in regions where the surface slopes steeply and elevation changes are more pronounced.
“These areas can be difficult to measure, but SIRAL enabled us to continuously observe the surface of the ice sheets with high precision and dense coverage, better than any previous system,” said Dr Helm.
Mark Drinkwater, ESA’s CryoSat Mission Scientist, noted, “These latest results offer a critical new perspective on the recent impact of climate change on the large ice sheets.
“Whilst CryoSat provides essential continuity in an ice sheet elevation record dating back to ESA’s ERS satellite data from the early 1990s, these results also highlight its design capability to capture regional patterns in the rate of change.
“This is particularly evident in parts of the Antarctic peninsula, where some of the more remarkable features add testimony on the impact of sustained peninsula warming at rates several times the global average.”