Faster-flowing glaciers fuel decades of polar ice loss
The longest satellite data record of ice-sheet change ever assembled has revealed that Greenland and Antarctica have lost a staggering 11 trillion tonnes of ice since the 1970s, driving global sea level up by more than three centimetres.
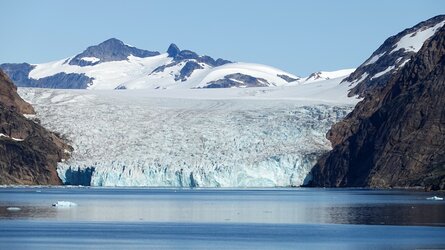
However, the new findings also highlight that the story is not simply one of ice melting at the surface. The glaciers that drain these vast ice sheets are also flowing faster, channelling enormous quantities of ice directly into the ocean.
Together, Greenland and Antarctica are now responsible for around a quarter of global sea-level rise.
These latest results, published today in the Nature journal Scientific Data, come from the Ice Sheet Mass Balance Intercomparison Exercise (IMBIE), a large international collaboration involving polar scientists from institutes around the world.
Supported by ESA and NASA, IMBIE brings together and reconciles measurements from different satellite missions to build the most consistent picture possible of how the planet's two great ice sheets have changed over several decades. By combining these observations, researchers can better understand how much ice has been lost, where that loss is occurring and how rapidly it is accelerating – all of which is crucial for improving projections of future sea-level rise.


Access the video
This is no easy task. Satellites do not all measure ice in the same way. Some spaceborne instruments use altimeters to detect changes in the height of the ice surface, others measure Earth's gravitational field while radar and optical sensors can track how quickly glaciers are moving.
Satellite missions have also evolved considerably over the past five decades, with new sensors, improved spatial resolution and increasingly sophisticated measuring techniques replacing older systems.
For the researchers, the challenge is therefore to make these many different observations comparable. The IMBIE team does this by bringing together independent estimates of ice-sheet mass balance – the difference between ice gains and losses – and carefully accounting for differences between satellite data, measurement techniques and periods of observation.
The result is a long-term record that allows scientists to distinguish genuine changes in the ice sheets from differences caused simply by the way the ice was measured.
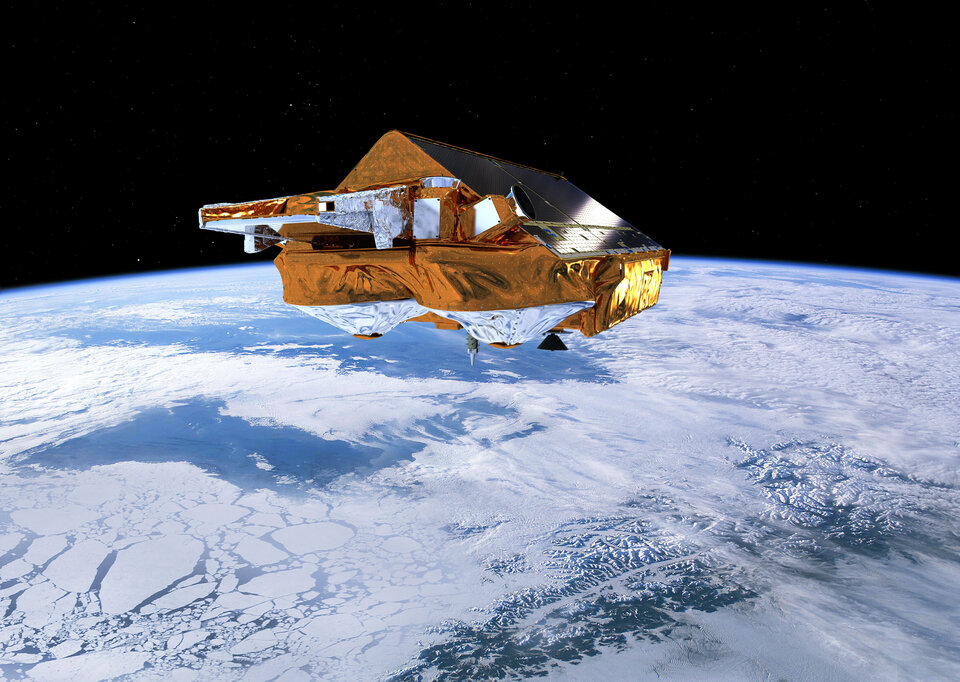
Drawing on data from 27 satellite missions – such as ESA’s CryoSat, the Copernicus Sentinels, the US–German Grace missions and early Landsat missions – the team analysed 42 independent surveys to trace changes in the ice sheets. The resulting new IMBIE record goes back to 1972 for Greenland and 1979 for Antarctica.
Inès Otosaka from Northumbria University in the UK and who led the study, said, “By reaching back to the 1970s, we can now see how the ice sheets have changed across half a century.
“More than four-fifths of the ice lost was discharged into the ocean by faster-flowing glaciers, rather than melted at the surface – which tells us the long-term trend is being driven by the dynamic response of the ice sheets to a warming ocean.”
Between 1979 and 2023, Greenland and Antarctica together lost 11.3 trillion tonnes of ice, contributing 3.14 centimetres to global sea-level rise.

Access the video
The research found that Greenland accounted for 1.81 centimetres of the sea-level rise, compared with 1.33 centimetres from Antarctica. Remarkably, 84% of the combined ice loss resulted from glaciers accelerating and discharging more ice into the ocean, while just 16% was caused by melting at the surface of the ice sheets.
Andrew Shepherd, also from Northumbria University and founder of IMBIE, said, “Just over three centimetres of sea-level rise may sound small, but that puts another six to nine million people at risk of coastal flooding and erosion. With the ice sheets set to lose much more ice in the decades ahead, global assessments like IMBIE are vital to protecting communities impacted by climate change.”
As the animated graph above shows, ice losses began to accelerate sharply from the 1990s onwards. Greenland, which was close to balance – meaning ice gains and losses were equal – in the 1970s, saw its annual ice loss increase from around 60 billion tonnes in the 1980s to 264 billion tonnes in the 2010s – a decade marked by repeated episodes of extreme summer melting.
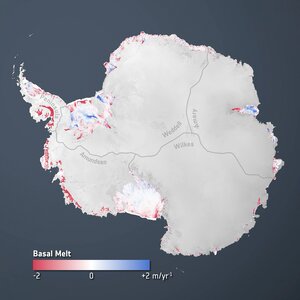
Antarctica followed a similar trajectory, with annual losses increasing from around 48 billion tonnes in the 1980s to 202 billion tonnes in the 2010s. Unlike Greenland, however, Antarctica’s net ice loss was driven entirely by ocean-driven melting and the acceleration of its outlet glaciers.
In West Antarctica, ice discharge has increased in every decade of the satellite record, driven in particular by the accelerating Pine Island and Thwaites Glaciers.

More recently, between 2020 and 2023, there has been a slowdown in overall ice loss. In Antarctica, unusually high snowfall across East Antarctica added enough ice to offset some of the losses from glaciers elsewhere on the continent. In Greenland, a run of relatively mild summers has substantially reduced surface melting, roughly halving the amount of ice lost in this way.
Scientists caution, however, that these changes represent short-term variations rather than a reversal of the long-term trend.
The ice sheets remain in a state of net loss, and year-to-year fluctuations in snowfall, temperature and glacier flow can temporarily mask the broader pattern of continuing ice loss.
Moreover, the findings underline the ice sheets’ central role in future sea-level rise. Their response to a warming climate is the single largest source of uncertainty in sea-level projections: high-end estimates of global sea-level rise by 2150 increase by a factor of 2.6 once the risk of ice-sheet instability is accounted for.
The continuous, half-century record of how the ice sheets are behaving is therefore vital to anticipating the risks facing the hundreds of millions of people who live in low-lying coastal areas.
While the research provides one of the clearest long-term assessments yet of how Greenland and Antarctica are changing, it also highlights the crucial role of sustained satellite observations, the collection and preservation of long-term datasets, and state-of-the-art data processing techniques used to turn observations into measures of ice-sheet change over decades.
By combining measurements from successive generations of satellites, long-term records that reveal trends that would be impossible to identify from short-term observations alone. These records are also essential for testing and improving the models used to project future ice loss and sea-level rise.
ESA’s Clement Albergel said, “The ability to assess the present-day state of our planet’s ice sheets and understand the dominant drivers of change so comprehensively, is only possible through sustained Earth observation and the long-term climate data records developed through research programmes such as ESA’s Climate Change Initiative.”
ESA’s Diego Fernandez also emphasised, “These findings demonstrate the fundamental importance of international scientific collaboration in addressing the major environmental changes of our time.
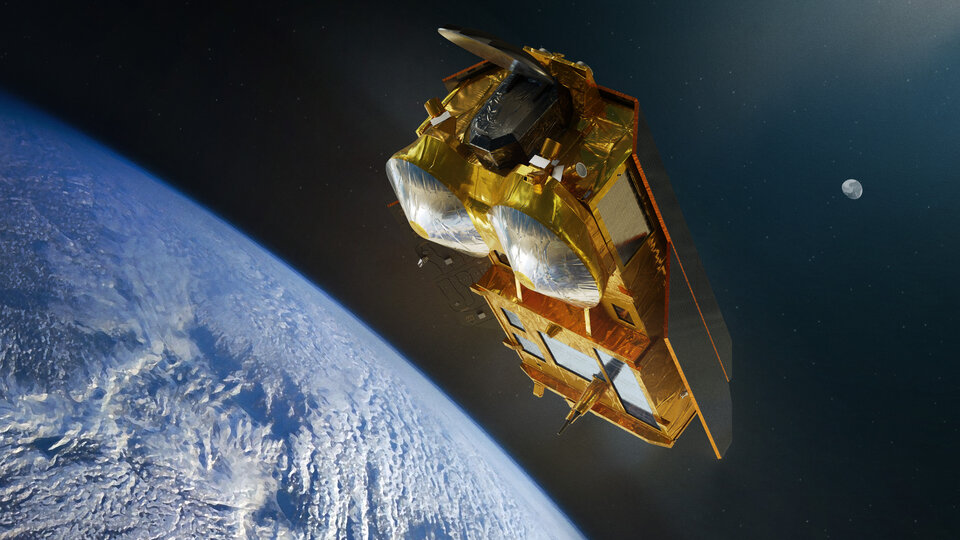
“In the years ahead, novel missions such as CRISTAL and ROSE-L will be critical to building on this work, enabling advanced monitoring of the rapid changes now affecting ice sheets and helping us better understand an evolving climate system in which abrupt and irreversible change can no longer be ruled out.”