Picturing permafrost in the Arctic
Permafrost plays an important role in the global climate and is also one of the components of the Earth system that is most sensitive to global warming. Maps, produced by ESA’s Climate Change Initiative, are providing new insights into thawing permafrost in the Arctic.
According to the latest Intergovernmental Panel on Climate Change Special Report, permafrost temperatures have increased to record high levels from the 1980s to present. As a consequence, concern is growing that significant amounts of greenhouse gases could be mobilised over the coming decades as it thaws, and potentially amplify climate change.
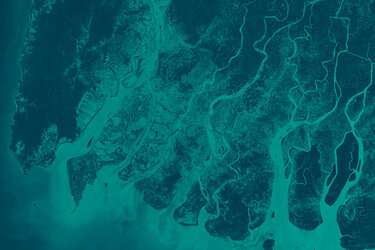
Permafrost is any ground that remains completely frozen for at least two consecutive years – these permanently frozen grounds are most common in high latitude regions such as Alaska and Siberia, or at high altitudes like the Andes and Himalayas.
Near the surface, Arctic permafrost soils contain large quantities of organic carbon and materials leftover from dead plants that cannot decompose or rot, whereas permafrost layers deeper down contain soils made of minerals. When permafrost thaws, it releases methane and carbon dioxide – adding these greenhouse gases to the atmosphere.
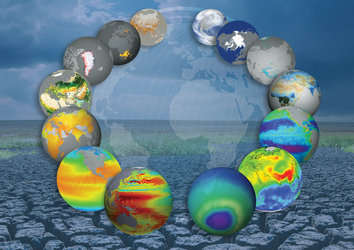
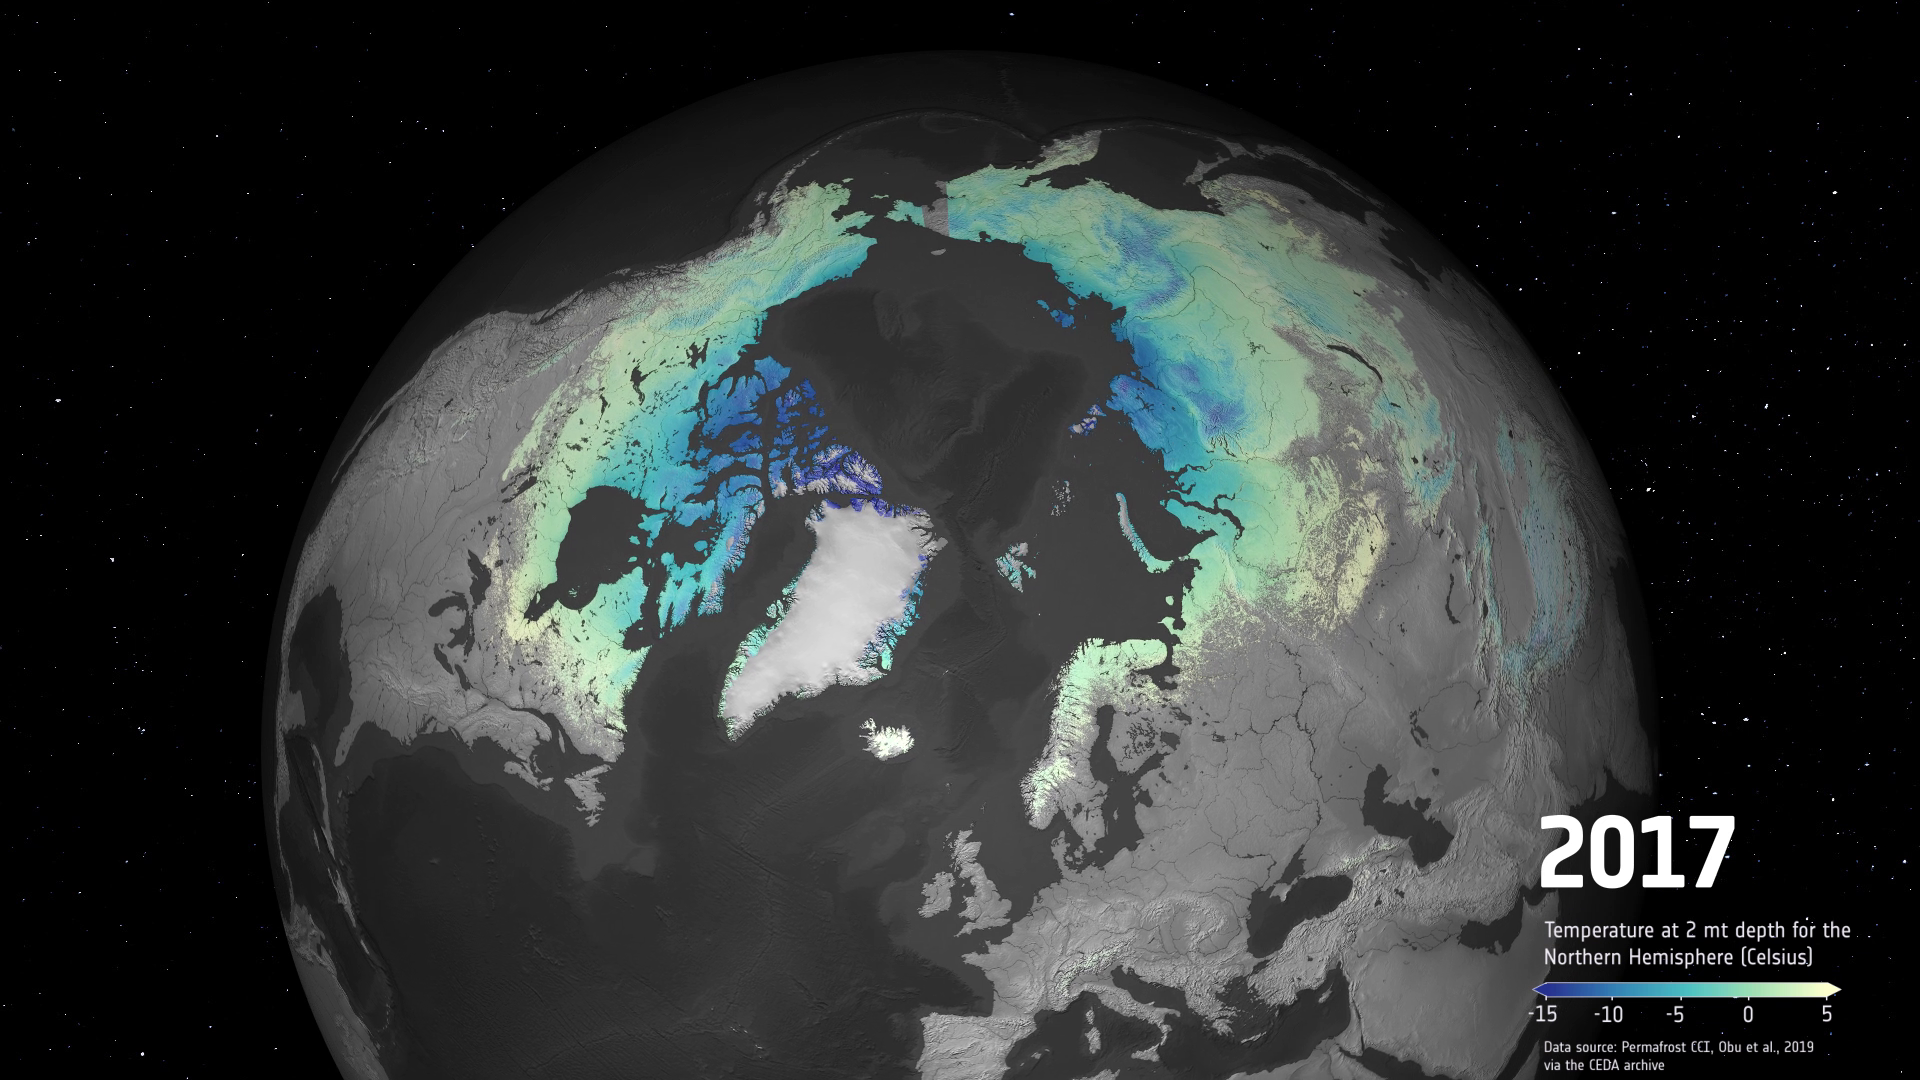
Since permafrost is a subsurface phenomenon, understanding it is challenging without relying strictly on in situ measurements. Satellite sensors cannot measure permafrost directly, but a dedicated project as part of ESA’s Climate Change Initiative (CCI), has used complementary satellite measurements of landscape features such as land-surface temperature and land cover to estimate permafrost extent.


Access the video
These data combined with in situ observations allow the permafrost team to get a panoptic view – improving the understanding of permafrost dynamics and the ability to model its future climate impact.
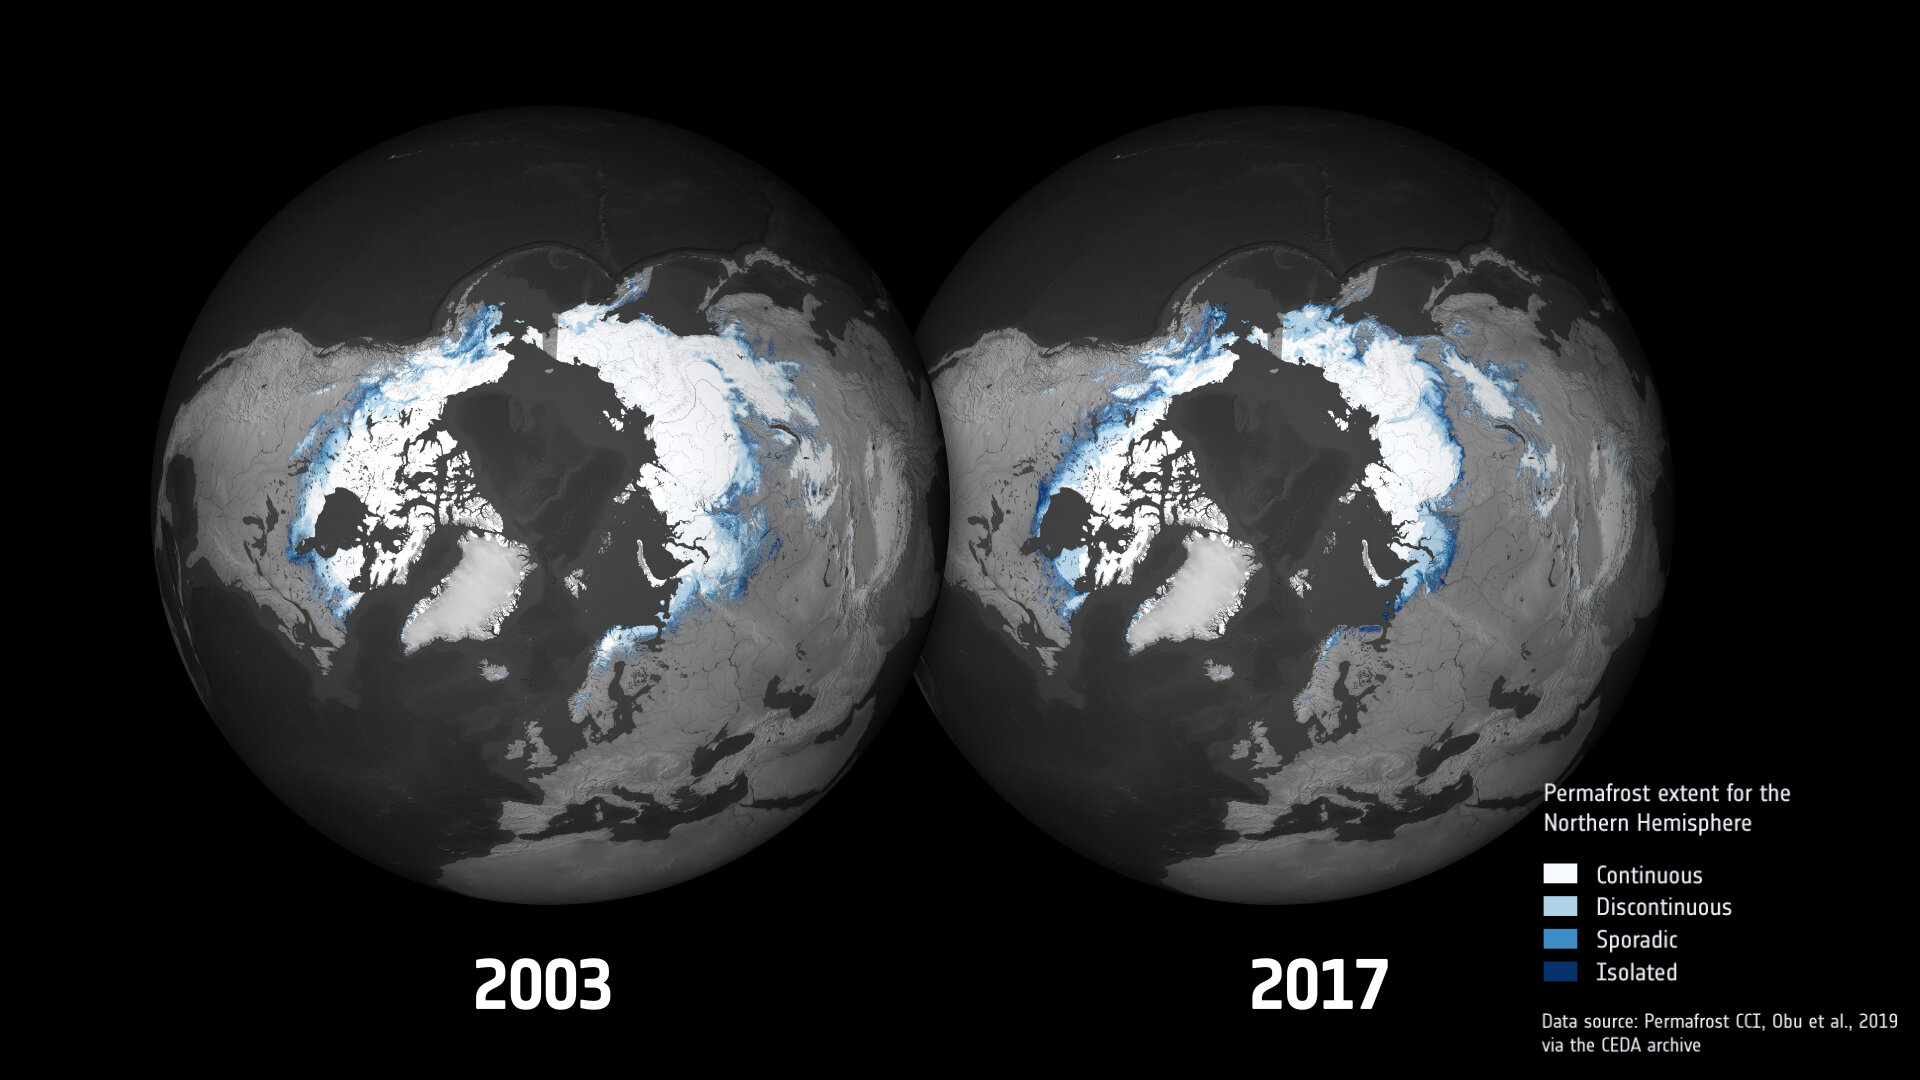
Annett Bartsch, science lead of the Permafrost CCI project, comments, “The maps show there is a clear variability in the extent of permafrost. This can be seen in North America as well as Northern Eurasia.”
However, she is careful to point out, “Although the maps provide useful insight with regard to interannual variability over a 14-year period, drawing conclusions regarding climate trends is not possible.”
Dr Bartsch advises researchers, “To wait and use permafrost maps covering the full 30 year time-series, which are expected to be ready for release by the project around the mid-2020.”
The use of Earth observation data can provide spatially consistent permafrost data coverage, even in the most remote and inaccessible areas such as the Arctic. The maps are provided by the Permafrost CCI team and cover the period 2003-17 at a spatial resolution of 1 km. The Permafrost CCI data are available online.
ESA Director of Earth Observation Programmes, Josef Aschbacher, adds, "The role of permafrost is believed to be underestimated in the climate change context. Therefore ESA and NASA have launched a joint initiative to call on the scientists in Europe and the US to study the impact of permafrost and other Arctic regions on global methane emissions. The initiative was jointly launched in December 2019 and a first science workshop is planned for June this year."
Access the video