Rosetta camera view of Tempel 1 brightness
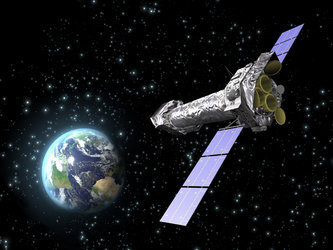
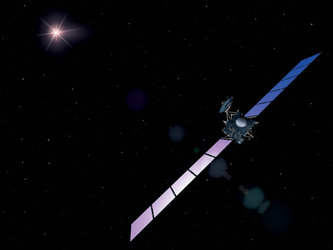
These animations, composed of images taken by the OSIRIS Narrow Angle Camera on board ESA's Rosetta spacecraft, shows how the brightness of Comet 9P/Tempel 1 developed after impact.

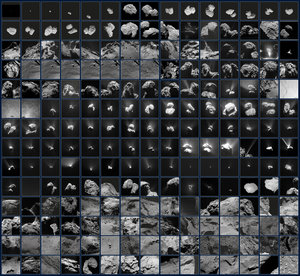
The separate false-colour images in this sequence from OSIRIS were taken at five-minute intervals around the impact time of 07:52 CEST (05:52 GMT/UT).
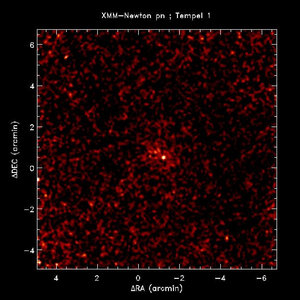
Although in the false-colour images (a still seen here at right) the increase in visual brightness is not so obvious, it becomes very clear in the animated surface plot below.

In this second animation, at left, the brightness of image pixels seen by OSIRIS is plotted 'three-dimensionally', i.e. the brighter they are, the higher they are in the plot.

Here a still image shows the first and last image from the animated sequence above.

Using its clear filter, the OSIRIS Narrow Angle also produced a 'light curve' of Comet 9P/Tempel 1. This shows how the comet's intensity varies in time, starting from impact.
The light curve shows that about 30 minutes after impact the brightness of the comet had increased by five times.
After this phase, scientists also noticed that the brightness level fluctuated for about one hour with no overall increase, then seemed to decrease, but much more slowly than the initial increase.
As more data come in from Rosetta, ESA scientists will be able to refine images and results.
For more information:
Gerhard Schwehm, ESA Rosetta Project Scientist
E-mail: gerhard.schwehm @ esa.int