Mars Express radar gauges water quantity around Mars’ south pole
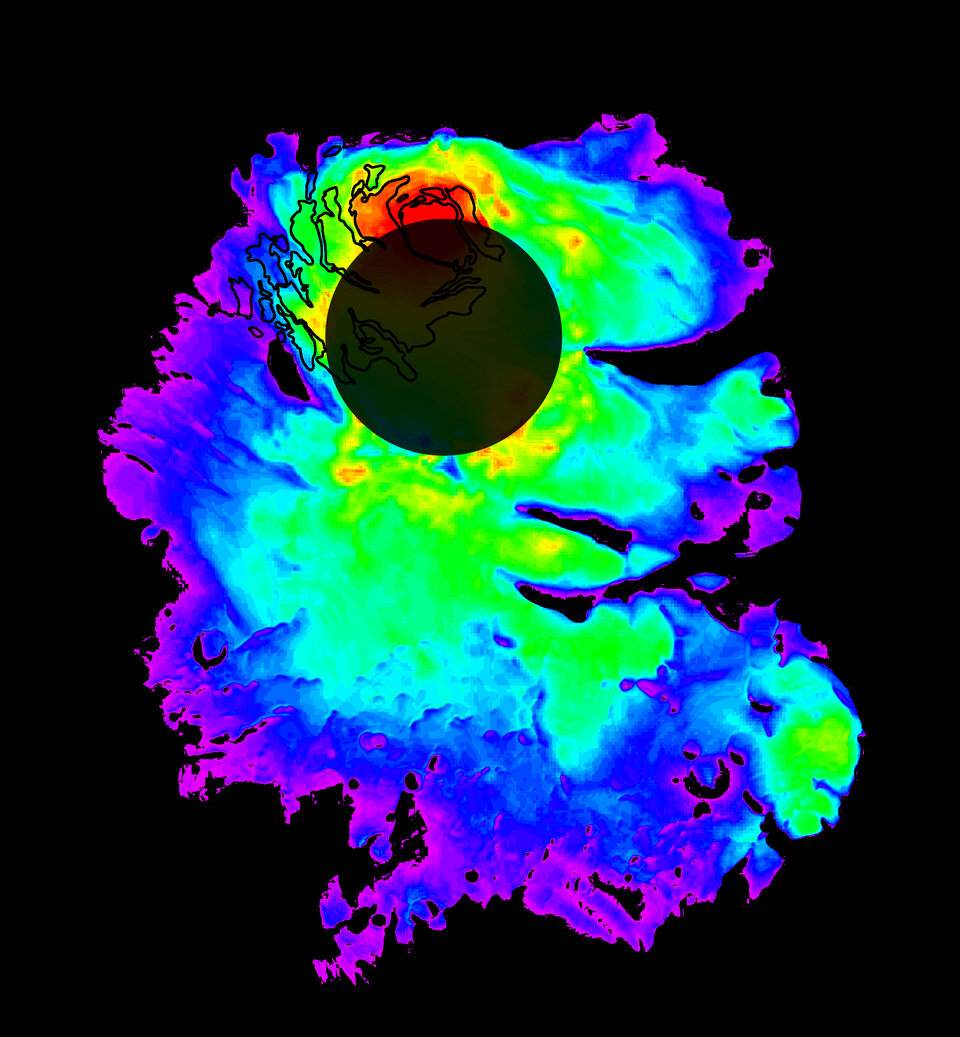
The amount of water trapped in frozen layers over Mars' south polar region is equivalent to a liquid layer about 11 metres deep covering the planet.
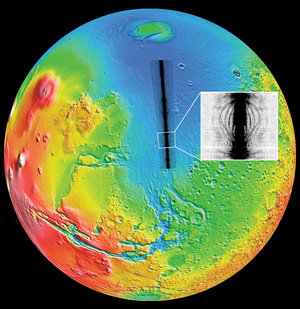
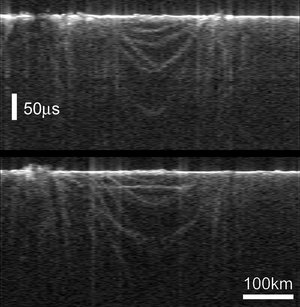
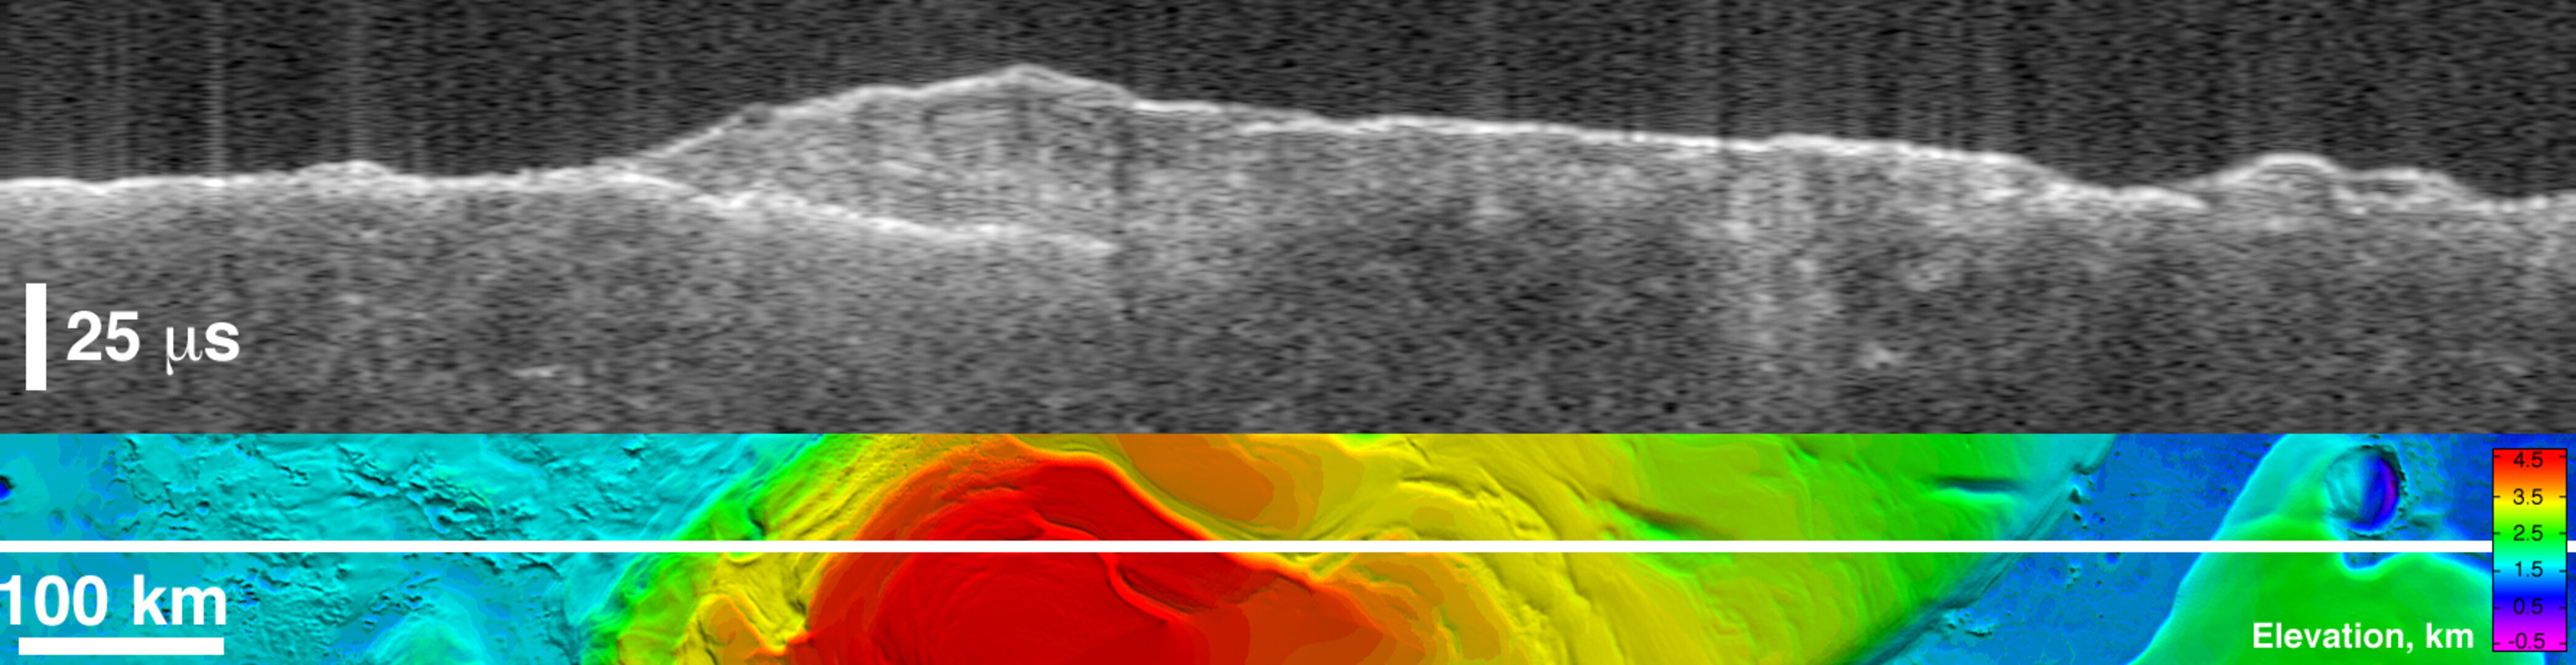
This new estimate comes from mapping the thickness of the dusty ice by the Mars Express radar instrument that has made more than 300 virtual slices through layered deposits covering the pole. The radar sees through icy layers to the lower boundary, which in places is as deep as 3.7 kilometres below the surface.

"The south polar layered deposits of Mars cover an area as wide as a big portion of Europe. The amount of water they contain has been estimated before, but never with the level of confidence this radar makes possible," said Dr Jeffrey Plaut of NASA's Jet Propulsion Laboratory, Pasadena (California), co-Principal Investigator for the radar and lead author of the study.
The instrument, named the Mars Advanced Radar for Subsurface and Ionospheric Sounding (MARSIS), is also mapping the thickness of similar layered deposits at the north pole of Mars.
"Our radar is doing its job extremely well," said Prof. Giovanni Picardi of the University of Rome 'La Sapienza', Principal Investigator for the instrument. "MARSIS is showing to be a very powerful tool to probe underneath the Martian surface, and it's showing how our team’s goals – such as probing the polar layered deposits - are being successfully achieved," he continued. "Not only MARSIS is providing us with the first ever views of Mars’ subsurface at those depths, but the details we are seeing are truly amazing. We are expecting even greater results when we will have concluded an on-going, sophisticated fine-tuning of our data processing methods. These should enable us to understand even better the surface and subsurface composition."

Polar layered deposits hold most of the known water on modern Mars, though other areas of the planet appear to have been very wet at times in the past. Understanding the history and fate of water on Mars is a key to studying whether Mars has ever supported life, because all known life depends on liquid water.
Plaut, Picardi and 22 other researchers report analysis of the Mars Express radar instrument's south polar observations in the online edition of the journal Science this week.
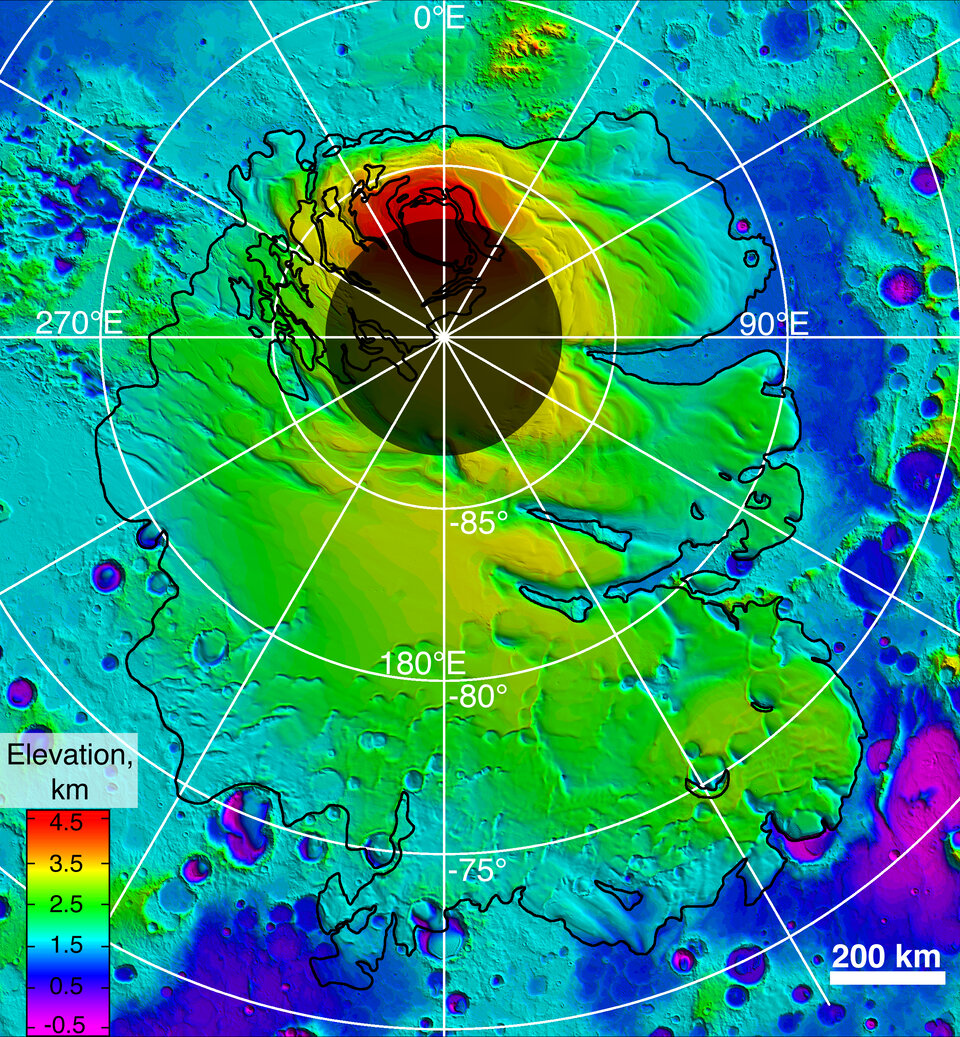
The polar layered deposits extend beyond and beneath a polar cap of bright-white frozen carbon dioxide and water at Mars' south pole. Dust darkens many of the layers. However, the strength of the echo that the radar receives from the rocky surface underneath the layered deposits suggests the composition of the layered deposits is at least 90 percent frozen water. One area with an especially bright reflection from the base of the deposits puzzles researchers. It resembles what a thin layer of liquid water might look like to the radar instrument, but the conditions are so cold that the presence of melted water is deemed highly unlikely.
Detecting the shape of the ground surface beneath the ice deposits provides information about even deeper structure of Mars. "We didn't really know where the bottom of the deposit was," Plaut said. "We can see now that the crust has not been depressed by the weight of the ice as it would be on the Earth. The crust and upper mantle of Mars are stiffer than the Earth's, probably because the interior of Mars is so much colder."
Note for editors
The results appear in the 15 March 2007 issue of the Science magazine, in an article by J. Plaut, G. Picardi et al., titled: "Subsurface Radar Sounding of the South Polar Layered Deposits of Mars."
The MARSIS instrument on board ESA's Mars Express spacecraft was developed jointly by the Italian Space Agency and NASA, under the scientific supervision of the University of Rome 'La Sapienza', in partnership with the JPL and the University of Iowa. JPL, a division of the California Institute of Technology, Pasadena, manages NASA's roles in Mars Express for the NASA Science Mission Directorate, Washington.
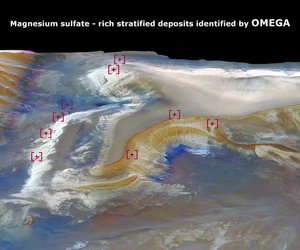
Understanding the history and fate of water on Mars is a key goal for the whole Mars Express mission. The HRSC high-resolution stereo camera imaged surface traces of glacial activity and flowing water. The OMEGA mapping spectrometer made unprecedented measurements of the mineralogical alterations of the surface due to the amount and state of water on the surface during various ages of Mars. The PFS and SPICAM instruments provided relevant new information about the presence of water vapour in the atmosphere.
For more information
Giovanni Picardi, MARSIS Principal Investigator, University of Rome 'La Sapienza', Italy
Email: picar @ infocom.uniroma1.it
Jeffrey Plaut, MARSIS Co-Principal Investigator, NASA/JPL, USA
Email: plaut @ jpl.nasa.gov
Agustin Chicarro, ESA Mars Express Project Scientist
Email: agustin.chicarro @ esa.int
Fred Jansen, ESA Mars Express Mission Manager
Email: fjansen @ rssd.esa.int
Enrico Flamini, ASI Mars Express Mission Manager
Email: enrico.flamini @ asi.it