


 Germany
 Austria
 Belgium
 Denmark
 Spain
Spain
 Estonia
 Finland
 France
 Greece
 Hungary
 Ireland
 Italy
Italy
 Luxembourg
 Norway
 The Netherlands
 Poland
 Portugal
 Czechia
 Romania
 United Kingdom
 Slovenia
 Sweden
 Switzerland


Four ways that space is changing ecosystem monitoring
With the theme of this year's World Environment Day being ecosystem restoration, we look at four projects using satellite data to improve the health of ecosystems around the globe.
Holistic ecosystem restoration
Ecosystem restoration is identified as one step towards tackling climate change and reaching the aims set out in the Paris Agreement. But it is a complex multi-sector and multi-stakeholder challenge involving governments, farms, indigenous peoples, development agencies and many others.
In 2018, German companies mundialis and terrestris began developing the HERMOSA platform as part of an ESA Business Applications activity. At first, HERMOSA was a system that used satellite imagery to locate degraded land and areas prone to food insecurity. But over the last three years, HERMOSA has grown into a complete four-in-one platform that identifies areas in need of restoration, provides practical assistance when planning and implementing a restoration project, enables the monitoring and reporting of plant growth, and shares information on best practices.
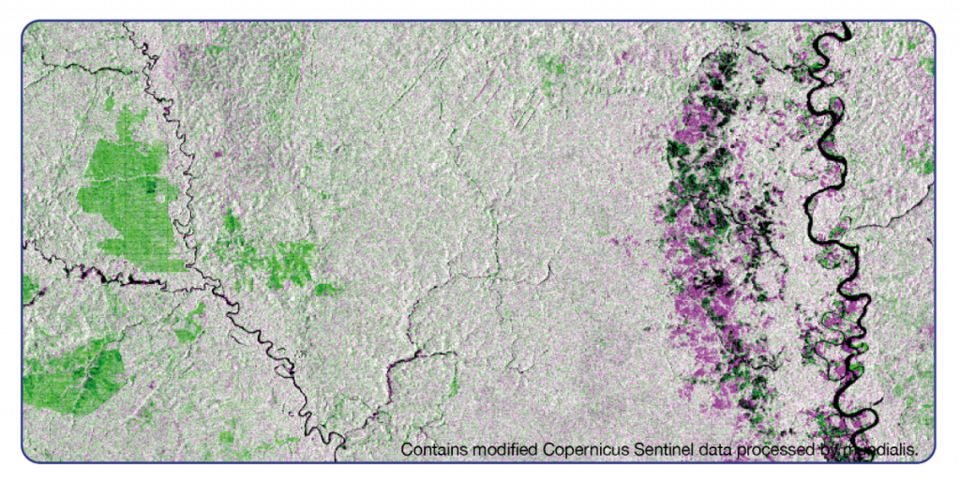
HERMOSA uses data from many satellites, including the Copernicus Sentinel-1 and -2 missions, to create maps of land cover and land use, including areas covered by forest. This enables users of the platform to monitor deforestation, forest degradation and forest gain, helping decision makers to locate areas in need of restoration, as well as to monitor logging and tree growth.
Measuring how ecosystems operate and function
With species and habitats dramatically declining, it is no exaggeration to say that biodiversity is facing a global crisis. But tracking the state of biodiversity is tricky; it requires operational monitoring systems that provide information on specific indicators. In the past, geographical coverage of input data was patchy, measurement methods differed from country to country, and a lack of longer-term data made it difficult to track trends. But now we have satellites monitoring Earth from space, collecting data regularly and at a high resolution. Furthermore, we have computers powerful enough to handle the large volumes of data that satellites send down to Earth.
An ESA Earth Observation Science for Society project called Remote Sensing for Environmental Biodiversity Variables (RS4EBVs) set out to investigate how satellite imagery could be used to monitor biodiversity. Using data from the Copernicus Sentinel-2 mission, the United Nations World Conservation Monitoring Centre explored and developed the potential of satellite remote sensing for tracking selected 'Essential Biodiversity Variables (EBVs)'. These information products are a step up from primary observations, and a step below high-level policy-relevant indicators.
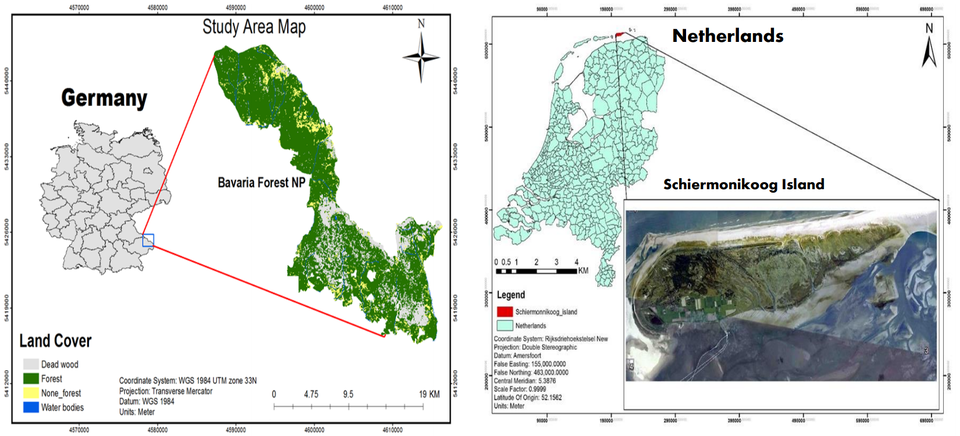
Monitoring ecosystems by tracking these EBVs was tested in a variety of locations and ecosystem types, including natural grasslands in the UK, salt marshes in the Netherlands and forest in Germany. One thing they evaluated was the functional diversity of the ecosystems, which measures the components that influence how ecosystems operate and function.
The project was a success, and its findings were transferred to the Group on Earth Observations Biodiversity Observation Network to further develop methods of monitoring functional diversity.
A step towards a global knowledge system on ecosystem biodiversity
Following RS4EBVs, another Earth Observation Science for Society project developed a set of Essential Biodiversity Variables based on satellite data. Led by the University of Zurich, the GlobDiversity project identified that data from Copernicus Sentinel-2 and the United States' Landsat 8 satellite could be used to monitor:
- Habitat fragmentation: Not only are some areas of natural habitats being lost, but remaining habitats are becoming smaller and more isolated.
- Land surface phenology: The change in the state of vegetation over the course of a year, including growth in spring and summer and loss of leaves in autumn.
- Canopy chlorophyll content: A measure of the total amount of chlorophyll – a green pigment that plants combine with light to make food – in a group of plants.
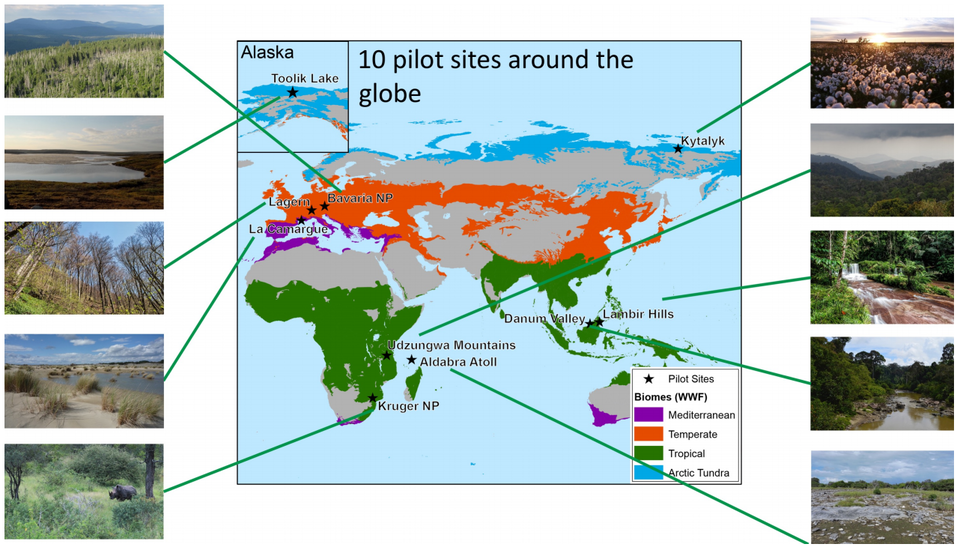
Based on data collected from space, these three EBVs were tested on ten pilot sites in four key biomes – arctic tundra, temperate forest, wetlands and tropical rainforest. For example, the project looked at how measurements of canopy chlorophyll content can be used to detect how the spruce bark beetle causes stress to ecosystem structure and function in Germany's Bavarian Forest National Park, what measuring habitat fragmentation can tell us about how local conservation and water management measures have impacted the habitat connectivity and fragmentation of the dark spreadwing damselfly in the Camargue region of France, and how monitoring land surface phenology can support local conservation practitioners and authorities to improve their ability to conserve the Siberian white crane in Russia’s Kytalyk National Park.
By contributing to identifying which EBVs can be retrieved from satellite data, GlobDiversity is supporting efforts to build a global knowledge system on ecosystem biodiversity.
Satellite data for sustainable resource management
The natural environment and healthy ecosystems provide many benefits to humans. Known as ecosystem services, these benefits include food provision, crop pollination, air purification and the natural control of pests and diseases.
UK data company Environment Systems has developed a tool called SENCE (Spatial Evidence for Natural Capital Evaluation) that provides maps and statistics of the natural stocks that provide ecosystem services – including geology, soil, air, water and all living things. Created using data from the Copernicus Sentinel-1 and -2 missions, as well as commercially available satellite imagery, these maps and statistics show land use, habitats and vegetation structure; this is particularly useful for places that are remote, dangerous or expensive for humans to access and take ground measurements.
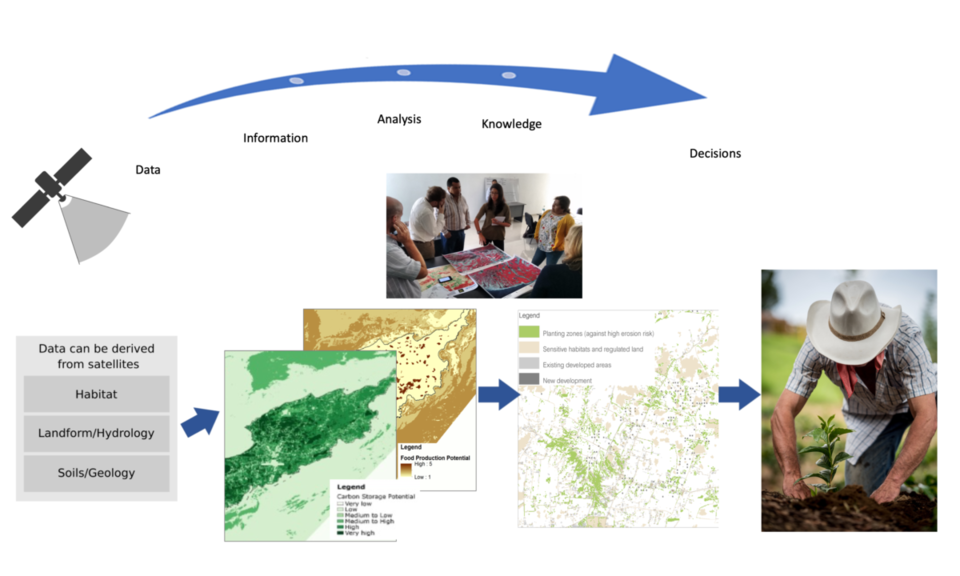
SENCE shows where the environment is working well, indicates how we can use the environment to our advantage, and supports decision making on the best sites for new activities and developments. For example, the tool has been used to assess the risk to human life from storm surges and flooding for five UK Overseas Territories; optical and radar satellite imagery was used to map terrain, the depth of coastal waters and the terrestrial vegetation in order to produce a storm surge risk model. It was found that coral reefs and mangroves are particularly important for counteracting wave energy and reducing the impact of storms; this informed restoration priorities and helped policymakers come up with practical solutions.
Overall, SENCE enables decision makers to monitor natural stocks, visualise and estimate the impact of any changes to the environment, and plan and deliver land management action for sustainable development.
